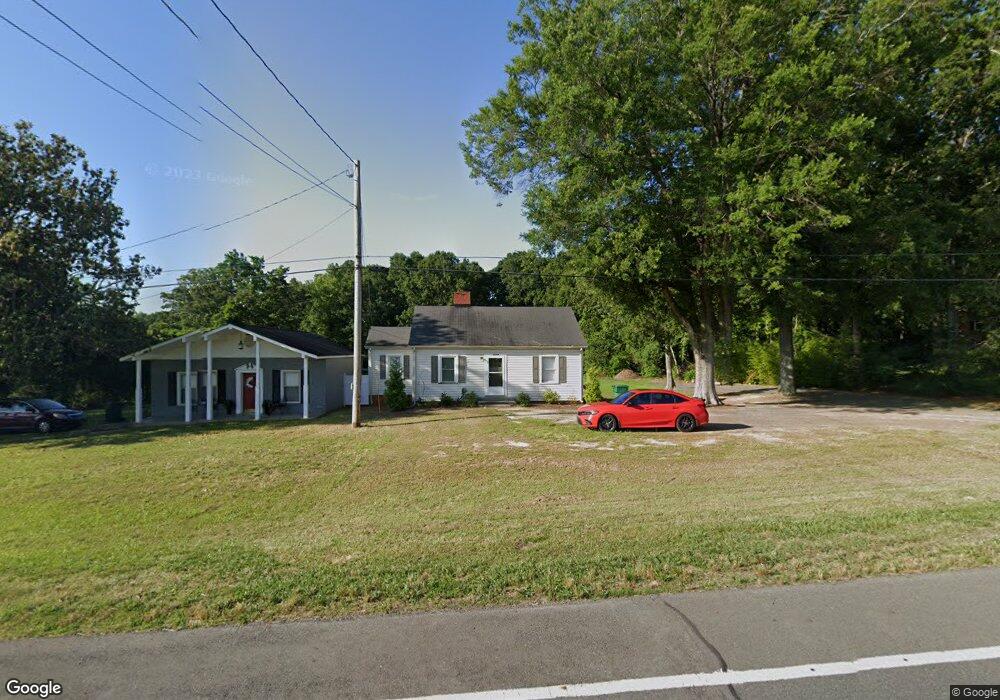
259 W Red Cross Rd Oakboro, NC 28129
Estimated Value: $225,245 - $281,000
2
Beds
1
Bath
960
Sq Ft
$268/Sq Ft
Est. Value
About This Home
This home is located at 259 W Red Cross Rd, Oakboro, NC 28129 and is currently estimated at $256,811, approximately $267 per square foot. 259 W Red Cross Rd is a home located in Stanly County with nearby schools including Locust Elementary School, West Stanly Middle School, and West Stanly High School.
Ownership History
Date
Name
Owned For
Owner Type
Purchase Details
Closed on
Feb 3, 2021
Sold by
Carpenter Johnny B and Carpenter Barbara M
Bought by
Carpenter Johnny B and Carpenter Barbara M
Current Estimated Value
Purchase Details
Closed on
Dec 29, 2020
Sold by
Carpenter Johnny B and Carpenter Barbara M
Bought by
Carpenter Johnny B and Carpenter Barbara M
Purchase Details
Closed on
Aug 8, 2019
Sold by
Barbee Jacqueline P
Bought by
Carpenter Johnny B and Carpenter Barbara M
Create a Home Valuation Report for This Property
The Home Valuation Report is an in-depth analysis detailing your home's value as well as a comparison with similar homes in the area
Home Values in the Area
Average Home Value in this Area
Purchase History
| Date | Buyer | Sale Price | Title Company |
|---|---|---|---|
| Carpenter Johnny B | -- | None Listed On Document | |
| Carpenter Johnny B | $15,000 | None Listed On Document | |
| Carpenter Johnny B | -- | None Listed On Document | |
| Carpenter Johnny B | -- | None Listed On Document | |
| Carpenter Johnny B | $160,000 | None Available | |
| Burleson Tammy Barbee | -- | None Available |
Source: Public Records
Tax History Compared to Growth
Tax History
| Year | Tax Paid | Tax Assessment Tax Assessment Total Assessment is a certain percentage of the fair market value that is determined by local assessors to be the total taxable value of land and additions on the property. | Land | Improvement |
|---|---|---|---|---|
| 2025 | $1,108 | $165,387 | $82,020 | $83,367 |
| 2024 | $913 | $118,571 | $49,590 | $68,981 |
| 2023 | $913 | $118,571 | $49,590 | $68,981 |
| 2022 | $913 | $118,571 | $49,590 | $68,981 |
| 2021 | $913 | $118,571 | $49,590 | $68,981 |
| 2020 | $845 | $102,795 | $40,915 | $61,880 |
| 2019 | $853 | $102,795 | $40,915 | $61,880 |
| 2018 | $853 | $102,795 | $40,915 | $61,880 |
| 2017 | $853 | $102,795 | $40,915 | $61,880 |
| 2016 | $795 | $95,833 | $36,645 | $59,188 |
| 2015 | $804 | $95,833 | $36,645 | $59,188 |
| 2014 | $824 | $95,833 | $36,645 | $59,188 |
Source: Public Records
Map
Nearby Homes
- 1974 Redwood Dr
- 159 Rubys Way Unit 35
- VAC Ridgebrook Ln
- 485 Hilltop Rd
- 133 Stonewater Dr Unit 16p
- TA3000 Plan at Streamside
- Declan Plan at Streamside
- TA1800 Plan at Streamside
- TA4000 Plan at Streamside
- Lenox Plan at Streamside
- Bayside Plan at Streamside
- Hudson Plan at Streamside
- Whitney Plan at Streamside
- 163 Stonewater Dr Unit 4p
- 164 Stonewater Dr Unit 53p
- 165 Stonewater Dr Unit 3p
- 241 Streamside Dr Unit 76
- 167 Stonewater Dr Unit 2p
- 1976 Ethan Ln
- 13253 Austin Rd
- 279 W Red Cross Rd
- 232 W Red Cross Rd
- 305 W Red Cross Rd
- 310 W Red Cross Rd
- 315 W Red Cross Rd
- 154 Smith Grove Rd
- 00 Smith Grove Rd
- 141 Smith Grove Rd
- 147 Smith Grove Rd
- 123 Smith Grove Rd
- 167 Smith Grove Rd
- 346 W Red Cross Rd
- 164 S Oak Ridge Rd
- 167 W Red Cross Rd
- 187 Smith Grove Rd
- 0 Charlotte Hwy Unit 3225445
- 205 Smith Grove Rd
- 153 W Red Cross Rd
- 226 Smith Grove Rd
- 217 Smith Grove Rd