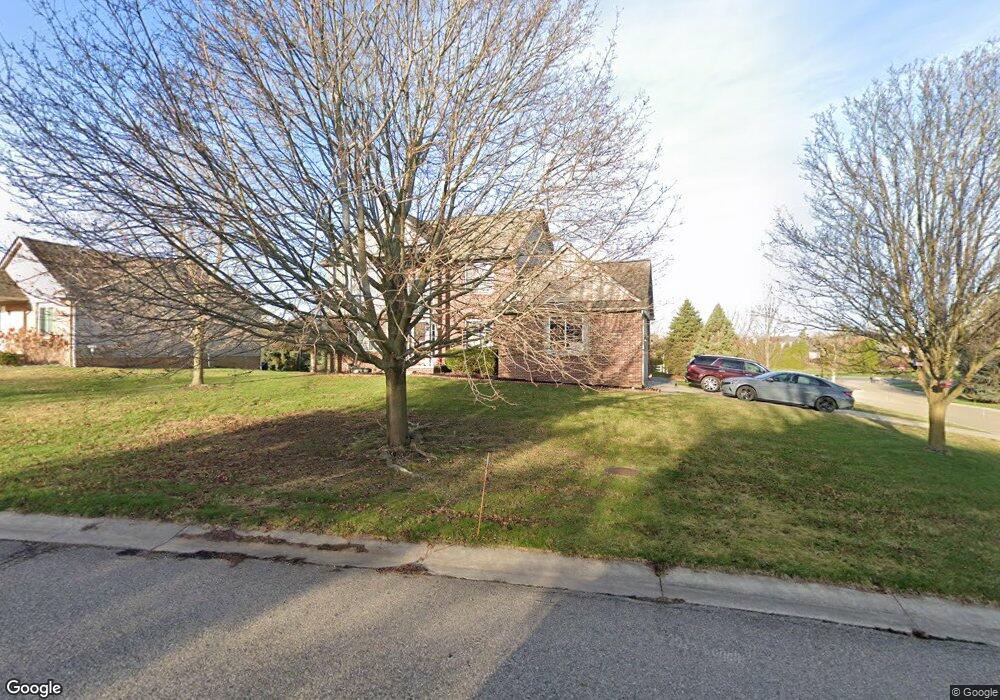
25907 Carriage Ln Unit Bldg-Unit South Lyon, MI 48178
Estimated Value: $499,552 - $552,000
3
Beds
3
Baths
1,923
Sq Ft
$276/Sq Ft
Est. Value
About This Home
This home is located at 25907 Carriage Ln Unit Bldg-Unit, South Lyon, MI 48178 and is currently estimated at $530,138, approximately $275 per square foot. 25907 Carriage Ln Unit Bldg-Unit is a home located in Oakland County with nearby schools including Sharon J. Hardy Elementary School, Centennial Middle School, and South Lyon High School.
Ownership History
Date
Name
Owned For
Owner Type
Purchase Details
Closed on
Jul 9, 2018
Sold by
Caldwell Todd A and Caldwell Amy D
Bought by
Springer Nicholas and Springer Crystal
Current Estimated Value
Purchase Details
Closed on
Mar 22, 2005
Sold by
Petsch Steven K and Petsch Stephanie L
Bought by
Caldwell Todd A and Caldwell Amy D
Home Financials for this Owner
Home Financials are based on the most recent Mortgage that was taken out on this home.
Original Mortgage
$225,000
Interest Rate
6%
Mortgage Type
New Conventional
Purchase Details
Closed on
Dec 20, 2001
Sold by
Healy Homes
Bought by
Petsch Steven K
Home Financials for this Owner
Home Financials are based on the most recent Mortgage that was taken out on this home.
Original Mortgage
$196,300
Interest Rate
7.26%
Purchase Details
Closed on
Jun 15, 2001
Sold by
A J Van Oyen Builders In
Bought by
Healy Homes
Create a Home Valuation Report for This Property
The Home Valuation Report is an in-depth analysis detailing your home's value as well as a comparison with similar homes in the area
Home Values in the Area
Average Home Value in this Area
Purchase History
| Date | Buyer | Sale Price | Title Company |
|---|---|---|---|
| Springer Nicholas | $335,000 | Hometown One Title Agency Ll | |
| Caldwell Todd A | $282,000 | Capital Title Ins Agency | |
| Petsch Steven K | $245,404 | -- | |
| Healy Homes | -- | -- |
Source: Public Records
Mortgage History
| Date | Status | Borrower | Loan Amount |
|---|---|---|---|
| Previous Owner | Caldwell Todd A | $225,000 | |
| Previous Owner | Petsch Steven K | $196,300 | |
| Closed | Caldwell Todd A | $57,000 |
Source: Public Records
Tax History Compared to Growth
Tax History
| Year | Tax Paid | Tax Assessment Tax Assessment Total Assessment is a certain percentage of the fair market value that is determined by local assessors to be the total taxable value of land and additions on the property. | Land | Improvement |
|---|---|---|---|---|
| 2024 | $3,606 | $195,240 | $0 | $0 |
| 2023 | $3,439 | $172,250 | $0 | $0 |
| 2022 | $4,707 | $151,490 | $0 | $0 |
| 2021 | $4,328 | $149,120 | $0 | $0 |
| 2020 | $3,185 | $146,630 | $0 | $0 |
| 2019 | $4,332 | $142,930 | $0 | $0 |
| 2018 | $3,171 | $139,140 | $0 | $0 |
| 2017 | $3,217 | $138,570 | $0 | $0 |
| 2016 | $3,232 | $133,740 | $0 | $0 |
| 2015 | -- | $122,660 | $0 | $0 |
| 2014 | -- | $110,520 | $0 | $0 |
| 2011 | -- | $91,920 | $0 | $0 |
Source: Public Records
Map
Nearby Homes
- 59213 Carriage Ln
- 25737 Mccrory Ln
- 956 N Mill St
- 951 N Mill St
- 25638 Mccrory Ln
- 25100 Martindale Rd
- 865 Challenging Trail
- 704 Grand Ct
- 58740 Carriage Ln
- 1215 Hackney Ct
- 24699 Martindale Rd
- 26644 International Dr
- 1082 Paddock Dr Unit 78
- 1146 Gentry Dr
- 25000 Carriage Ln
- 58423 Winnowing Cir N
- 285 Ash Ct Unit 14
- 24499 Martindale Rd
- 1206 Coach House Ln
- The Columbia Plan at Sterling Trail
- 25907 Carriage Ln
- 25895 Carriage Ln
- 25883 Carriage Ln
- 25931 Carriage Ln
- 25871 Carriage Ln
- 25922 Carriage Ln
- 25910 Carriage Ln
- 25898 Carriage Ln
- 25934 Carriage Ln
- 25859 Carriage Ln
- 25943 Carriage Ln
- 25886 Carriage Ln
- 852 Stoney Dr Unit 113
- 860 Stoney Dr
- 844 Stoney Dr
- 25874 Carriage Ln
- 25955 Carriage Ln
- 25946 Carriage Ln
- 868 Stoney Dr
- 25847 Carriage Ln