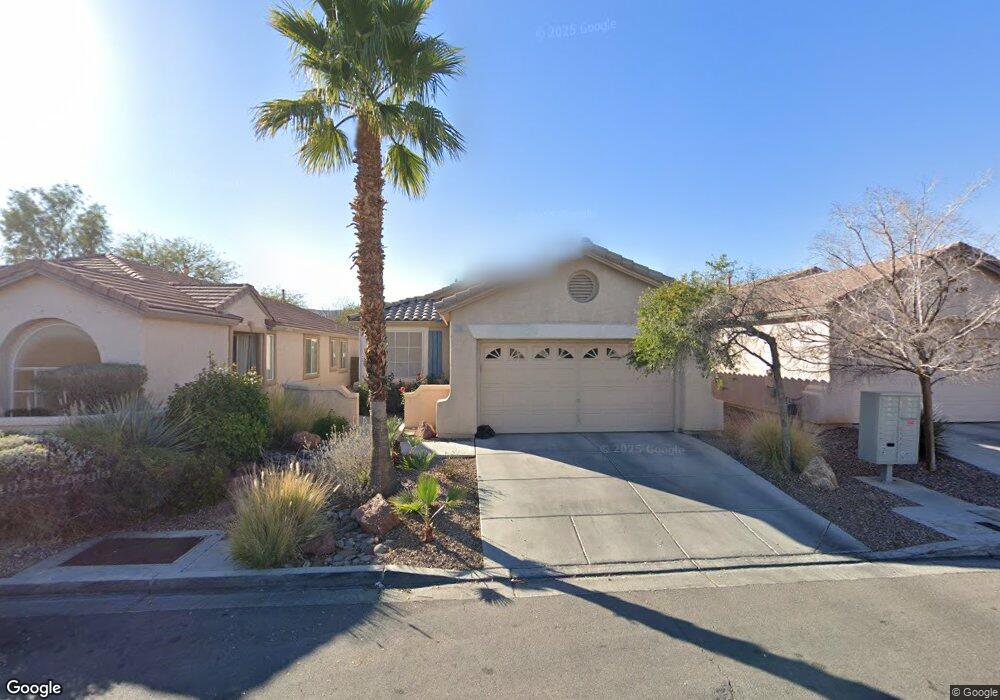
2591 Chantemar St Unit none Las Vegas, NV 89135
Summerlin NeighborhoodEstimated Value: $472,408 - $535,000
3
Beds
2
Baths
1,310
Sq Ft
$388/Sq Ft
Est. Value
About This Home
This home is located at 2591 Chantemar St Unit none, Las Vegas, NV 89135 and is currently estimated at $508,852, approximately $388 per square foot. 2591 Chantemar St Unit none is a home located in Clark County with nearby schools including D'Vorre & Hal Ober Elementary School, Victoria Fertitta Middle School, and Palo Verde High School.
Ownership History
Date
Name
Owned For
Owner Type
Purchase Details
Closed on
Jun 25, 2022
Sold by
Cullen Brown Morris and Cullen Kari E
Bought by
Chantemar Llc
Current Estimated Value
Purchase Details
Closed on
May 23, 2019
Sold by
Starr Michael
Bought by
Laduke Megan
Home Financials for this Owner
Home Financials are based on the most recent Mortgage that was taken out on this home.
Original Mortgage
$280,250
Interest Rate
4.1%
Mortgage Type
New Conventional
Purchase Details
Closed on
Jun 8, 2018
Sold by
Starr Michael Preston and Starr Sandra Antoinette
Bought by
Starr Michael and Starr Sandra
Purchase Details
Closed on
May 15, 2018
Sold by
Starr Sandra
Bought by
Starr Michael
Purchase Details
Closed on
Feb 2, 2009
Sold by
Greenpoint Mortgage Funding Inc
Bought by
Starr Michael Preston and Starr Sandra Antoinette Nowicki
Purchase Details
Closed on
Oct 8, 2008
Sold by
Tabora Marivel
Bought by
Greenpoint Mortgage Funding Inc
Purchase Details
Closed on
Aug 25, 2004
Sold by
Tabora Marivel
Bought by
Tabora Marivel
Home Financials for this Owner
Home Financials are based on the most recent Mortgage that was taken out on this home.
Original Mortgage
$279,900
Interest Rate
6.75%
Mortgage Type
Unknown
Purchase Details
Closed on
Jul 2, 2004
Sold by
Tabora Roy P
Bought by
Tabora Marivel
Home Financials for this Owner
Home Financials are based on the most recent Mortgage that was taken out on this home.
Original Mortgage
$279,900
Interest Rate
6.75%
Mortgage Type
Unknown
Purchase Details
Closed on
Jun 28, 2004
Sold by
Nepp Darlene A
Bought by
Tabora Maribel
Home Financials for this Owner
Home Financials are based on the most recent Mortgage that was taken out on this home.
Original Mortgage
$279,900
Interest Rate
6.75%
Mortgage Type
Unknown
Purchase Details
Closed on
Aug 24, 2001
Sold by
Nepp Darlene
Bought by
Nepp Darlene A
Home Financials for this Owner
Home Financials are based on the most recent Mortgage that was taken out on this home.
Original Mortgage
$137,000
Interest Rate
6.87%
Purchase Details
Closed on
Jun 28, 2000
Sold by
Coleman Toll Ltd Partnership
Bought by
Nepp Darlene
Home Financials for this Owner
Home Financials are based on the most recent Mortgage that was taken out on this home.
Original Mortgage
$132,950
Interest Rate
8.67%
Create a Home Valuation Report for This Property
The Home Valuation Report is an in-depth analysis detailing your home's value as well as a comparison with similar homes in the area
Home Values in the Area
Average Home Value in this Area
Purchase History
| Date | Buyer | Sale Price | Title Company |
|---|---|---|---|
| Chantemar Llc | -- | None Listed On Document | |
| Laduke Megan | $295,000 | Chicago Title Of Nevada I | |
| Starr Michael | -- | Chicago Title Of Nevada I | |
| Starr Michael | -- | Accommodation | |
| Starr Michael | -- | Accommodation | |
| Starr Michael Preston | $169,000 | Old Republic Title Company O | |
| Greenpoint Mortgage Funding Inc | $190,000 | Old Republic Title Co Of Nv | |
| Tabora Marivel | -- | Nevada Title Company | |
| Tabora Marivel | -- | Nevada Title Company | |
| Tabora Maribel | $349,900 | Nevada Title Company | |
| Nepp Darlene A | -- | Fidelity National Title | |
| Nepp Darlene | $137,735 | First American Title Co |
Source: Public Records
Mortgage History
| Date | Status | Borrower | Loan Amount |
|---|---|---|---|
| Previous Owner | Laduke Megan | $280,250 | |
| Previous Owner | Tabora Maribel | $279,900 | |
| Previous Owner | Nepp Darlene A | $137,000 | |
| Previous Owner | Nepp Darlene | $132,950 |
Source: Public Records
Tax History Compared to Growth
Tax History
| Year | Tax Paid | Tax Assessment Tax Assessment Total Assessment is a certain percentage of the fair market value that is determined by local assessors to be the total taxable value of land and additions on the property. | Land | Improvement |
|---|---|---|---|---|
| 2025 | $2,847 | $118,881 | $49,350 | $69,531 |
| 2024 | $2,349 | $118,881 | $49,350 | $69,531 |
| 2023 | $2,349 | $102,219 | $36,750 | $65,469 |
| 2022 | $2,075 | $92,431 | $32,200 | $60,231 |
| 2021 | $2,013 | $83,279 | $26,250 | $57,029 |
| 2020 | $1,951 | $83,270 | $26,600 | $56,670 |
| 2019 | $1,895 | $80,316 | $24,500 | $55,816 |
| 2018 | $1,808 | $72,375 | $18,550 | $53,825 |
| 2017 | $2,137 | $72,698 | $18,200 | $54,498 |
| 2016 | $1,693 | $67,195 | $12,950 | $54,245 |
| 2015 | $1,689 | $64,351 | $12,950 | $51,401 |
| 2014 | $1,636 | $53,919 | $8,750 | $45,169 |
Source: Public Records
Map
Nearby Homes
- 2664 Chantemar St
- 10232 Country Flats Ln
- 2630 Wind Spinner St
- 10451 Howling Coyote Ave
- 2381 Lilac Cove St
- 2231 Desert Prairie St
- 2704 Messina Ct
- 10592 Calico Pines Ave
- 2766 Glen Port St
- 10513 Rusty Railroad Ave
- 10667 Olympic Pine Dr
- 10413 Burensburg Ave
- 2053 Gravel Hill St Unit 203
- 2152 Quarry Ridge St Unit 207
- 10728 Rivendell Ave Unit 2
- 2052 Gravel Hill St Unit 201
- 2052 Gravel Hill St Unit 207
- 2611 Good Fellows St
- 2153 Jade Creek St Unit 106
- 10281 Rarity Ave
- 2591 Chantemar St
- 2579 Chantemar St
- 2603 Chantemar St
- 2567 Chantemar St
- 2615 Chantemar St
- 2555 Chantemar St
- 2592 Chantemar St
- 2604 Chantemar St
- 2580 Chantemar St
- 2543 Chantemar St
- 2543 Chantemar St
- 2616 Chantemar St
- 2568 Chantemar St
- 2556 Chantemar St
- 2628 Chantemar St
- 2531 Chantemar St
- 2572 Spruce Creek Dr
- 2564 Spruce Creek Dr
- 2640 Chantemar St
- 2580 Spruce Creek Dr