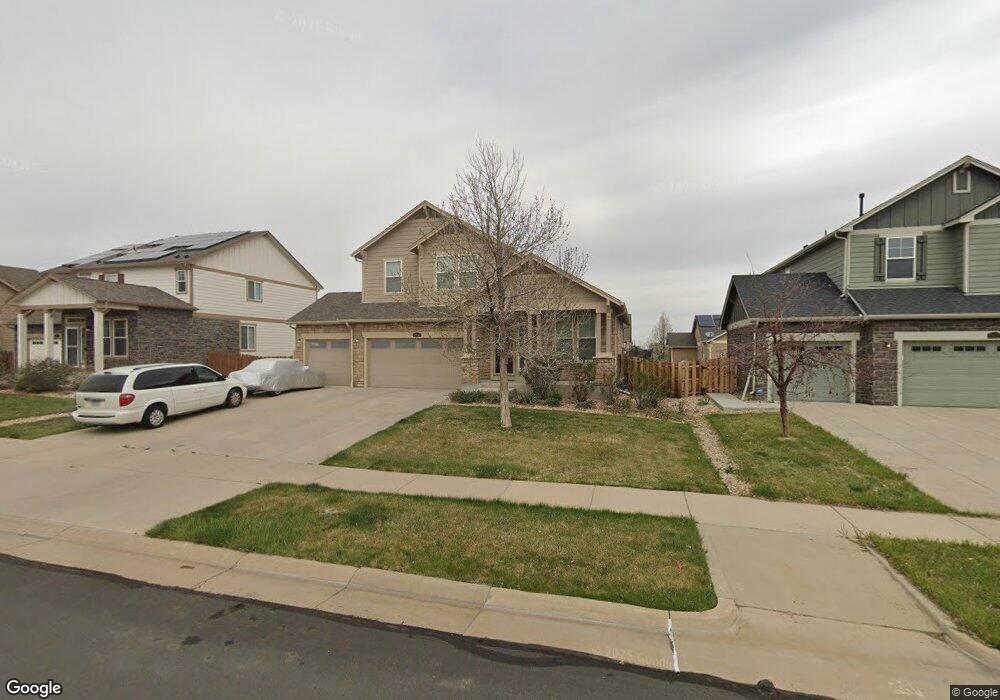
25911 E 3rd Place Aurora, CO 80018
Estimated Value: $526,972 - $557,000
4
Beds
3
Baths
2,860
Sq Ft
$190/Sq Ft
Est. Value
About This Home
This home is located at 25911 E 3rd Place, Aurora, CO 80018 and is currently estimated at $544,743, approximately $190 per square foot. 25911 E 3rd Place is a home located in Arapahoe County with nearby schools including Vista Peak Exploratory and Vista Peak 9-12 Preparatory.
Ownership History
Date
Name
Owned For
Owner Type
Purchase Details
Closed on
Jul 13, 2018
Sold by
Hp Colorado I Llc
Bought by
Hpa Borrower 2018 1 Ms Llc
Current Estimated Value
Purchase Details
Closed on
May 14, 2018
Sold by
Johnson Darrick
Bought by
Hp Colorado I Llc
Purchase Details
Closed on
Nov 3, 2014
Sold by
Johnson Renee
Bought by
Johnson Darrick
Purchase Details
Closed on
Nov 23, 2011
Sold by
Lennar Colorado Allc
Bought by
Johnson Darrick Allen and Johnson Renee Michelle
Home Financials for this Owner
Home Financials are based on the most recent Mortgage that was taken out on this home.
Original Mortgage
$224,169
Interest Rate
3.75%
Mortgage Type
FHA
Create a Home Valuation Report for This Property
The Home Valuation Report is an in-depth analysis detailing your home's value as well as a comparison with similar homes in the area
Purchase History
| Date | Buyer | Sale Price | Title Company |
|---|---|---|---|
| Hpa Borrower 2018 1 Ms Llc | -- | None Available | |
| Hp Colorado I Llc | $415,000 | Stewart Title | |
| Johnson Darrick | -- | None Available | |
| Johnson Darrick Allen | $230,000 | North American Title |
Source: Public Records
Mortgage History
| Date | Status | Borrower | Loan Amount |
|---|---|---|---|
| Previous Owner | Johnson Darrick Allen | $224,169 |
Source: Public Records
Tax History
| Year | Tax Paid | Tax Assessment Tax Assessment Total Assessment is a certain percentage of the fair market value that is determined by local assessors to be the total taxable value of land and additions on the property. | Land | Improvement |
|---|---|---|---|---|
| 2025 | $5,284 | $34,497 | -- | -- |
| 2024 | $5,179 | $36,187 | -- | -- |
| 2023 | $5,179 | $36,187 | $0 | $0 |
| 2022 | $4,447 | $28,961 | $0 | $0 |
| 2021 | $4,584 | $28,961 | $0 | $0 |
| 2020 | $5,265 | $0 | $0 | $0 |
| 2019 | $5,338 | $30,016 | $0 | $0 |
| 2018 | $4,171 | $22,550 | $0 | $0 |
| 2017 | $3,861 | $22,550 | $0 | $0 |
| 2016 | $3,496 | $20,815 | $0 | $0 |
| 2015 | $3,428 | $20,815 | $0 | $0 |
| 2014 | -- | $17,982 | $0 | $0 |
| 2013 | -- | $18,990 | $0 | $0 |
Source: Public Records
Map
Nearby Homes
- 26346 E Canal Place
- 26368 E 3rd Ave
- 664 N Yantley St
- 27853 E 8th Ave
- 27837 E 9th Ln
- 27922 E 10th Dr
- 27646 E 10th Dr
- 27584 E 6th Dr
- 27790 E 9th Place
- 27626 E 6th Dr
- 901 N Vandriver Way
- 26344 E 4th Place
- 25566 E 4th Place
- 25481 E 2nd Place
- 300 N Patsburg St
- 25466 E 4th Place
- 25883 E Archer Dr
- 25447 E 4th Ave
- 35 N Newcastle Ct
- 28459 E 5th Place
- 25891 E 3rd Place
- 25931 E 3rd Place
- 25910 E 3rd Ave
- 25871 E 3rd Place
- 25951 E 3rd Place
- 25890 E 3rd Ave
- 25930 E 3rd Ave
- 233 N Muscadine Ct
- 25950 E 3rd Ave
- 25870 E 3rd Ave
- 25851 E 3rd Place
- 25971 E 3rd Place
- 238 N Muscadine Ct
- 223 N Muscadine Ct
- 25831 E 3rd Place
- 228 N Muscadine Ct
- 224 N Millbrook Ct
- 25830 E 3rd Ave
- 25939 E 3rd Ave
- 251 N Newbern Way
Your Personal Tour Guide
Ask me questions while you tour the home.