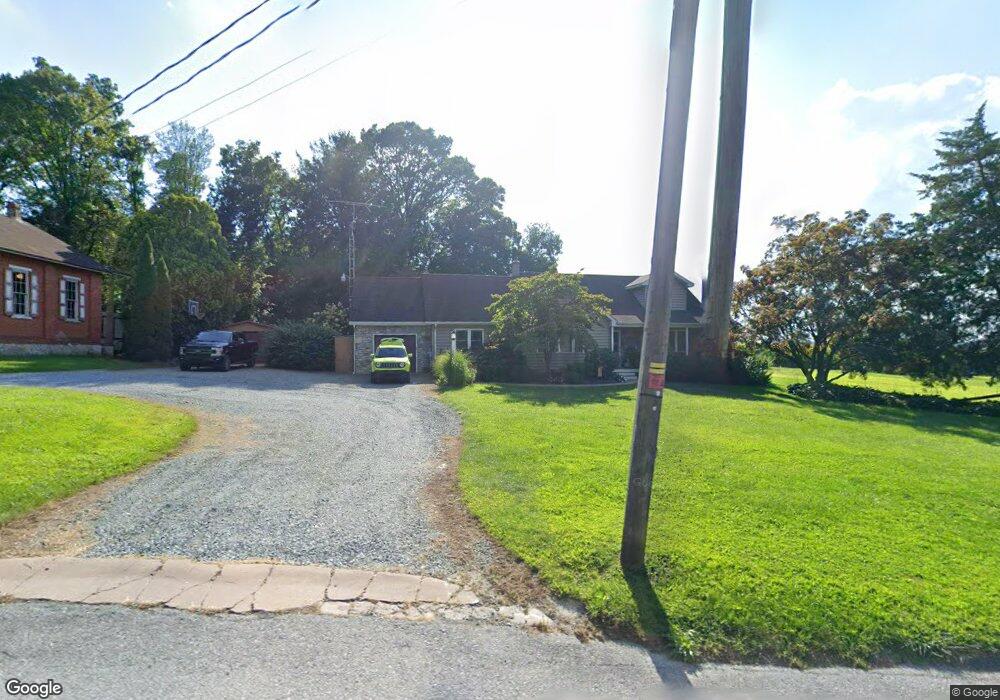
2592 Robert Fulton Hwy Peach Bottom, PA 17563
Fulton Township NeighborhoodEstimated Value: $254,000 - $360,000
3
Beds
2
Baths
1,993
Sq Ft
$163/Sq Ft
Est. Value
About This Home
This home is located at 2592 Robert Fulton Hwy, Peach Bottom, PA 17563 and is currently estimated at $324,260, approximately $162 per square foot. 2592 Robert Fulton Hwy is a home located in Lancaster County with nearby schools including Solanco High School.
Ownership History
Date
Name
Owned For
Owner Type
Purchase Details
Closed on
Feb 14, 2024
Sold by
Myers Brian R and Myers Jessica R
Bought by
Myers Brian R and Myers Jessica R
Current Estimated Value
Purchase Details
Closed on
Aug 29, 2012
Bought by
Myers Brian R
Purchase Details
Closed on
Mar 23, 2000
Sold by
Myers Robert N and Myers Betty J
Bought by
Myers Brian R
Home Financials for this Owner
Home Financials are based on the most recent Mortgage that was taken out on this home.
Original Mortgage
$70,000
Interest Rate
8.31%
Mortgage Type
Seller Take Back
Create a Home Valuation Report for This Property
The Home Valuation Report is an in-depth analysis detailing your home's value as well as a comparison with similar homes in the area
Home Values in the Area
Average Home Value in this Area
Purchase History
| Date | Buyer | Sale Price | Title Company |
|---|---|---|---|
| Myers Brian R | -- | None Listed On Document | |
| Myers Brian R | -- | -- | |
| Myers Brian R | -- | -- |
Source: Public Records
Mortgage History
| Date | Status | Borrower | Loan Amount |
|---|---|---|---|
| Previous Owner | Myers Brian R | $70,000 |
Source: Public Records
Tax History Compared to Growth
Tax History
| Year | Tax Paid | Tax Assessment Tax Assessment Total Assessment is a certain percentage of the fair market value that is determined by local assessors to be the total taxable value of land and additions on the property. | Land | Improvement |
|---|---|---|---|---|
| 2025 | $2,998 | $206,300 | $64,600 | $141,700 |
| 2024 | $2,998 | $192,200 | $50,500 | $141,700 |
| 2023 | $2,908 | $192,200 | $50,500 | $141,700 |
| 2022 | $2,780 | $192,200 | $50,500 | $141,700 |
| 2021 | $2,610 | $192,200 | $50,500 | $141,700 |
| 2020 | $2,610 | $192,200 | $50,500 | $141,700 |
| 2019 | $2,610 | $192,200 | $50,500 | $141,700 |
| 2018 | $591 | $192,200 | $50,500 | $141,700 |
| 2017 | $2,599 | $158,500 | $24,300 | $134,200 |
| 2016 | $2,598 | $158,500 | $24,300 | $134,200 |
| 2015 | $625 | $158,500 | $24,300 | $134,200 |
| 2014 | $1,799 | $158,500 | $24,300 | $134,200 |
Source: Public Records
Map
Nearby Homes
- 131 Mason Dixon Rd
- 154 Black Barren Rd
- 19 Jubilee Park
- 243 Little Britain Rd
- 0 New Bridge Rd Unit MDCC2014434
- 125 Brer Rabbit Rd
- 45 Blarney Ln
- 140 Arcadia Trace
- 8 Weaver Meadows Rd
- 34 Arc Dr
- 0 Nottingham Rd
- 97 W Kanawha Dr
- 661 Pilot Town Rd
- Lots 126-127 Codjus Dr
- 89 Codjus Dr
- 743 Bell Manor Rd
- 67 Merry Knoll Ct
- 424 Old Conowingo Rd
- L 9 Londonderry Ln Unit 9
- Lot 16 Londonderry Ln
- 2596 Robert Fulton Hwy
- 2588 Robert Fulton Hwy
- 135 Brabson Ln
- 2601 Robert Fulton Hwy
- 129 Brabson Ln
- 2604 Robert Fulton Hwy
- 111 Brabson Ln
- 2605 Robert Fulton Hwy
- 126 Brabson Ln
- 2608 Robert Fulton Hwy
- 2607 Robert Fulton Hwy
- 120 Brabson Ln
- 0 Brabson Ln
- 2610 Robert Fulton Hwy
- 2609 Robert Fulton Hwy
- 109 Brabson Ln
- 2611 Robert Fulton Hwy
- 2612 Robert Fulton Hwy
- 107 Brabson Ln
- 2613 Robert Fulton Hwy