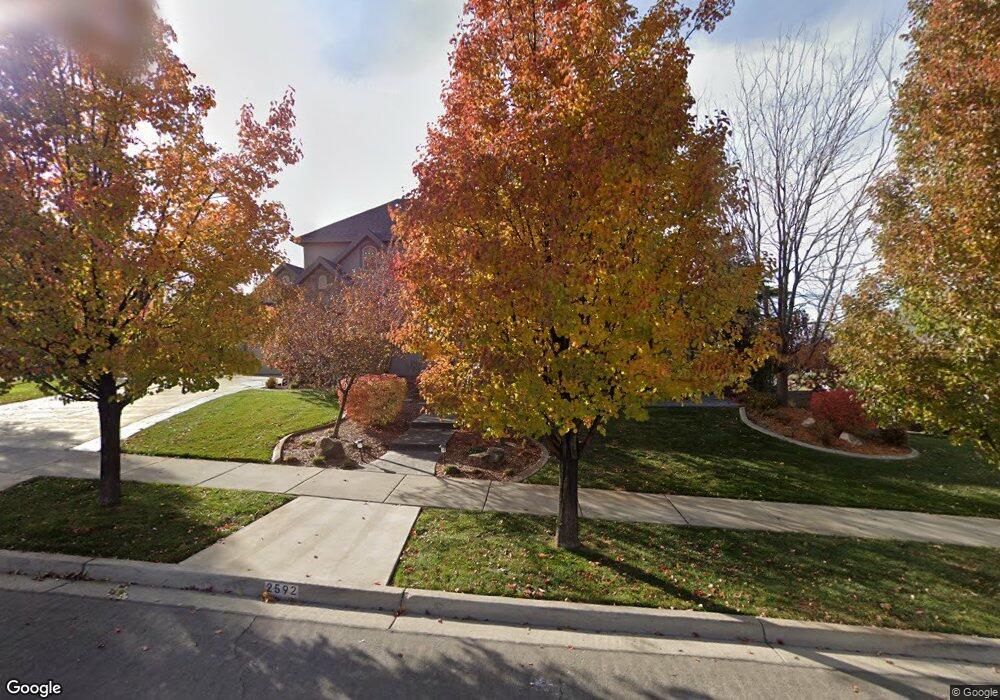
2592 S Lookout Ridge Dr Unit TC 42A Mapleton, UT 84664
Estimated Value: $1,747,000 - $2,201,777
6
Beds
5
Baths
6,846
Sq Ft
$288/Sq Ft
Est. Value
About This Home
This home is located at 2592 S Lookout Ridge Dr Unit TC 42A, Mapleton, UT 84664 and is currently estimated at $1,974,389, approximately $288 per square foot. 2592 S Lookout Ridge Dr Unit TC 42A is a home located in Utah County with nearby schools including Maple Ridge Elementary, Mapleton Junior High School, and Maple Mountain High School.
Ownership History
Date
Name
Owned For
Owner Type
Purchase Details
Closed on
Apr 11, 2018
Sold by
Robinson Taylor J
Bought by
Robinson Taylor J and Robinson Molly
Current Estimated Value
Home Financials for this Owner
Home Financials are based on the most recent Mortgage that was taken out on this home.
Original Mortgage
$712,000
Outstanding Balance
$612,166
Interest Rate
4.43%
Mortgage Type
New Conventional
Estimated Equity
$1,362,223
Purchase Details
Closed on
Jan 29, 2016
Sold by
Bingham Erick and Bingham Melisa
Bought by
Bingham Melisa and Bingham Erick
Purchase Details
Closed on
Jun 4, 2015
Sold by
Miner Kevin G
Bought by
Bingham Erick and Bingham Melisa
Home Financials for this Owner
Home Financials are based on the most recent Mortgage that was taken out on this home.
Original Mortgage
$620,000
Interest Rate
3.62%
Mortgage Type
New Conventional
Purchase Details
Closed on
Dec 1, 2014
Sold by
Wilson Joseph A and Wilson Jami S
Bought by
Miner Kevin G
Home Financials for this Owner
Home Financials are based on the most recent Mortgage that was taken out on this home.
Original Mortgage
$417,000
Interest Rate
3.92%
Mortgage Type
New Conventional
Purchase Details
Closed on
Aug 23, 2013
Sold by
Miner Kevin G and Miner Jean
Bought by
Wilson Joseph A and Wilson Jami S
Home Financials for this Owner
Home Financials are based on the most recent Mortgage that was taken out on this home.
Original Mortgage
$417,000
Interest Rate
4.51%
Mortgage Type
New Conventional
Purchase Details
Closed on
Jul 27, 2012
Sold by
Salisbury Developers Inc
Bought by
Miner Kevin G and Miner Jean
Home Financials for this Owner
Home Financials are based on the most recent Mortgage that was taken out on this home.
Original Mortgage
$295,583
Interest Rate
3.65%
Mortgage Type
New Conventional
Purchase Details
Closed on
Jun 6, 2012
Sold by
Miner Kevin G and Miner Jean
Bought by
Salisbury Developers Inc
Home Financials for this Owner
Home Financials are based on the most recent Mortgage that was taken out on this home.
Original Mortgage
$295,583
Interest Rate
3.65%
Mortgage Type
New Conventional
Purchase Details
Closed on
May 1, 2012
Sold by
Tc At Mapleton Llc
Bought by
Miner Kevin G and Miner Jean
Home Financials for this Owner
Home Financials are based on the most recent Mortgage that was taken out on this home.
Original Mortgage
$250,000
Interest Rate
3.79%
Mortgage Type
Construction
Create a Home Valuation Report for This Property
The Home Valuation Report is an in-depth analysis detailing your home's value as well as a comparison with similar homes in the area
Home Values in the Area
Average Home Value in this Area
Purchase History
| Date | Buyer | Sale Price | Title Company |
|---|---|---|---|
| Robinson Taylor J | -- | Greenbrier Title Ins Agency | |
| Robinson Taylor J | -- | Greenbrier Title Ins Agency | |
| Bingham Melisa | -- | None Available | |
| Bingham Erick | -- | Gt Title Services | |
| Miner Kevin G | -- | Gt Title Services | |
| Wilson Joseph A | -- | Provo Land Title Co | |
| Miner Kevin G | -- | Provo Land Title Company | |
| Salisbury Developers Inc | -- | Provo Land Title | |
| Miner Kevin G | -- | Merdian Title Co |
Source: Public Records
Mortgage History
| Date | Status | Borrower | Loan Amount |
|---|---|---|---|
| Open | Robinson Taylor J | $712,000 | |
| Previous Owner | Bingham Erick | $620,000 | |
| Previous Owner | Miner Kevin G | $417,000 | |
| Previous Owner | Wilson Joseph A | $417,000 | |
| Previous Owner | Miner Kevin G | $295,583 | |
| Previous Owner | Salisbury Developers Inc | $250,000 |
Source: Public Records
Tax History Compared to Growth
Tax History
| Year | Tax Paid | Tax Assessment Tax Assessment Total Assessment is a certain percentage of the fair market value that is determined by local assessors to be the total taxable value of land and additions on the property. | Land | Improvement |
|---|---|---|---|---|
| 2025 | $8,223 | $928,460 | $532,800 | $1,154,000 |
| 2024 | $8,223 | $805,545 | $0 | $0 |
| 2023 | $8,146 | $803,015 | $0 | $0 |
| 2022 | $7,816 | $1,383,900 | $541,000 | $842,900 |
| 2021 | $6,601 | $986,800 | $338,400 | $648,400 |
| 2020 | $6,497 | $939,600 | $316,100 | $623,500 |
| 2019 | $6,027 | $889,600 | $266,100 | $623,500 |
| 2018 | $6,278 | $882,400 | $265,900 | $616,500 |
| 2017 | $6,027 | $449,875 | $0 | $0 |
| 2016 | $5,899 | $437,775 | $0 | $0 |
| 2015 | $5,775 | $425,950 | $0 | $0 |
| 2014 | $5,488 | $397,480 | $0 | $0 |
Source: Public Records
Map
Nearby Homes
- 525 N 1550 W Unit COLUMB
- 525 N 1550 W Unit WINDSO
- 525 N 1550 W Unit HILDAL
- 3713 S White Ash Dr
- 525 N 1550 W Unit BALLAR
- 525 N 1550 W Unit CALDWE
- 525 N 1550 W Unit DREXEL
- 525 N 1550 W Unit MORGAN
- 525 N 1550 W Unit WAKEFI
- 525 N 1550 W Unit ARDEN
- 3958 S Sage Wood Ave Unit CHAMBE
- 275 S 2800 St E Unit 201
- 274 S 2800 St E Unit 206
- Julia Plan at
- Konlee Plan at
- Emmet Plan at
- 831 W Rock Ridge Dr
- 1353 Mapleton Heights Ct
- 1767 S 800 W
- 1827 Hillcrest Cir
- 2592 S Lookout Ridge Dr
- 752 W Overlook Ridge Dr Unit 43
- 752 W Overlook Ridge Dr
- 2591 S Lookout Ridge Dr
- 2538 S Lookout Ridge Dr
- 2538 S Lookout Ridge Dr
- 727 W Overlook Ridge Dr Unit 2
- 727 W Overlook Ridge Dr
- 727 W Overlook Ridge Dr Unit 2
- 2543 S Lookout Ridge Dr
- 778 W Overlook Ridge Dr Unit 44
- 778 W Overlook Ridge Dr
- 2503 S Lookout Ridge Dr
- 2482 S Lookout Ridge Dr Unit 40
- 683 Overlook Ridge Cir
- 767 W Overlook Ridge Dr
- 767 W Overlook Ridge Dr
- 767 W Overlook Ridge Dr Unit 1
- 767 W Overlook Ridge Dr Unit 1
- 2503 S Lookout Ridge Dr