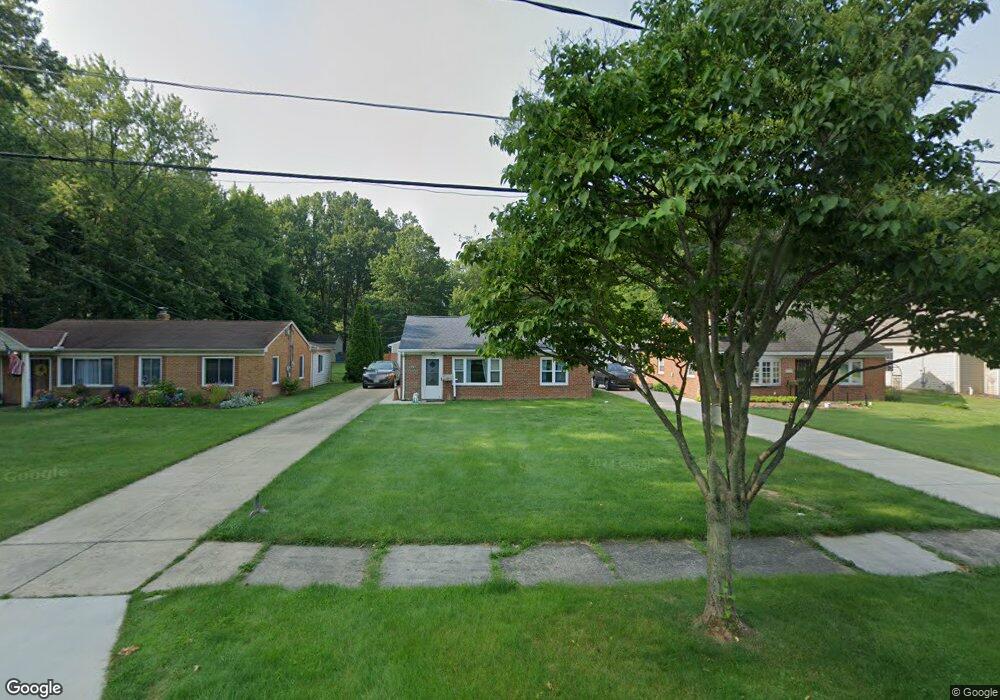
25927 Myrtle Ave Olmsted Falls, OH 44138
Estimated Value: $233,000 - $297,000
3
Beds
3
Baths
1,740
Sq Ft
$150/Sq Ft
Est. Value
About This Home
This home is located at 25927 Myrtle Ave, Olmsted Falls, OH 44138 and is currently estimated at $261,348, approximately $150 per square foot. 25927 Myrtle Ave is a home located in Cuyahoga County with nearby schools including Falls-Lenox Primary Elementary School, Olmsted Falls Intermediate Building, and Olmsted Falls Middle School.
Ownership History
Date
Name
Owned For
Owner Type
Purchase Details
Closed on
Mar 31, 2025
Sold by
Judith Ann Jones Family Trust and Garman Lynne Allyson
Bought by
Mcelroy Gilbert P
Current Estimated Value
Purchase Details
Closed on
Sep 25, 2020
Sold by
Judith A Jones Revocable Trust and Jones Judith A
Bought by
Judith Ann Jones Family Trust and Garmin
Purchase Details
Closed on
Mar 1, 2015
Sold by
Jones Judith A and Jones Thomas C
Bought by
Mcelroy Gilbert P
Home Financials for this Owner
Home Financials are based on the most recent Mortgage that was taken out on this home.
Original Mortgage
$75,000
Interest Rate
3.67%
Mortgage Type
Seller Take Back
Purchase Details
Closed on
Jan 25, 2005
Sold by
Jones Thomas C and Jones Judith A
Bought by
Jones Thomas C and Jones Judith A
Purchase Details
Closed on
Jan 1, 1975
Bought by
Jones Judith A and Jones Thomas C
Create a Home Valuation Report for This Property
The Home Valuation Report is an in-depth analysis detailing your home's value as well as a comparison with similar homes in the area
Home Values in the Area
Average Home Value in this Area
Purchase History
| Date | Buyer | Sale Price | Title Company |
|---|---|---|---|
| Mcelroy Gilbert P | $178,300 | None Listed On Document | |
| Judith Ann Jones Family Trust | -- | None Listed On Document | |
| Mcelroy Gilbert P | $75,000 | None Available | |
| Jones Thomas C | -- | -- | |
| Jones Judith A | -- | -- |
Source: Public Records
Mortgage History
| Date | Status | Borrower | Loan Amount |
|---|---|---|---|
| Previous Owner | Mcelroy Gilbert P | $75,000 |
Source: Public Records
Tax History Compared to Growth
Tax History
| Year | Tax Paid | Tax Assessment Tax Assessment Total Assessment is a certain percentage of the fair market value that is determined by local assessors to be the total taxable value of land and additions on the property. | Land | Improvement |
|---|---|---|---|---|
| 2024 | $4,795 | $62,405 | $9,695 | $52,710 |
| 2023 | $5,042 | $54,570 | $11,760 | $42,810 |
| 2022 | $5,004 | $54,570 | $11,760 | $42,810 |
| 2021 | $4,398 | $54,570 | $11,760 | $42,810 |
| 2020 | $4,333 | $47,880 | $10,330 | $37,560 |
| 2019 | $3,857 | $136,800 | $29,500 | $107,300 |
| 2018 | $1,453 | $35,420 | $10,330 | $25,100 |
| 2017 | $2,753 | $30,880 | $8,930 | $21,950 |
| 2016 | $2,738 | $30,880 | $8,930 | $21,950 |
| 2015 | -- | $30,880 | $8,930 | $21,950 |
| 2014 | -- | $28,600 | $8,260 | $20,340 |
Source: Public Records
Map
Nearby Homes
- 25941 Myrtle Ave
- 25913 Myrtle Ave
- 25955 Myrtle Ave
- 25969 Myrtle Ave
- 25896 Water St
- 25874 Water St
- 25997 Myrtle Ave
- 25880 Myrtle Ave
- 26033 Myrtle Ave
- 25920 Myrtle Ave
- 25942 Myrtle Ave
- 26063 Myrtle Ave
- 25982 Myrtle Ave
- 25854 Water St
- 25747 Western Reserve Ln
- 25830 Water St
- 25727 Western Reserve Ln
- 26064 Myrtle Ave
- 26070 Myrtle Ave
- 25740 Western Reserve Ln