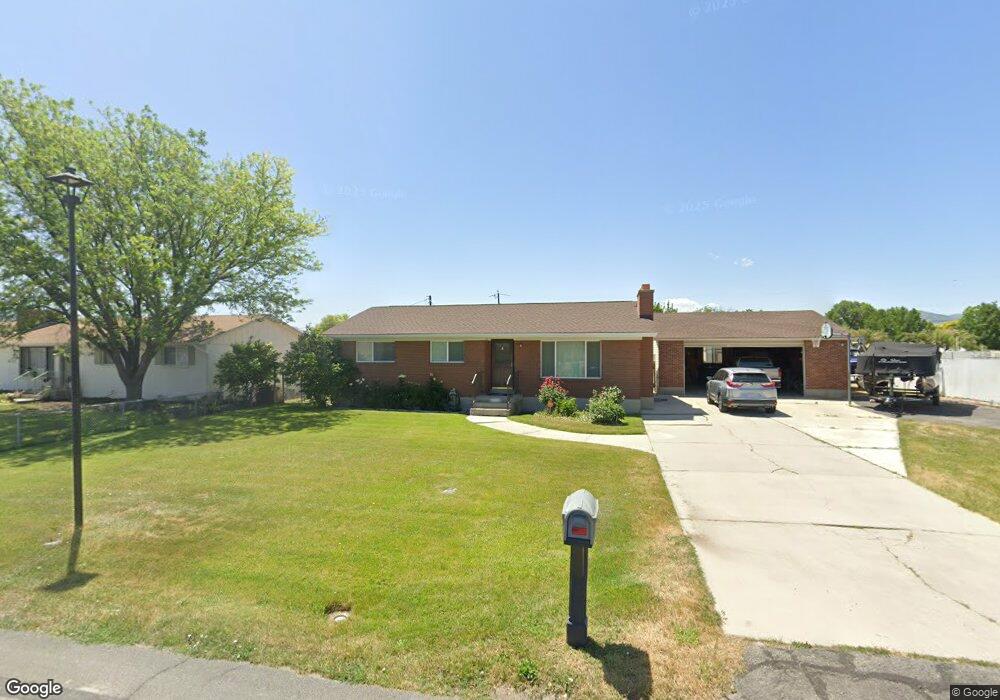
2593 W 12270 S Riverton, UT 84065
Estimated Value: $522,000 - $594,000
3
Beds
2
Baths
1,108
Sq Ft
$501/Sq Ft
Est. Value
About This Home
This home is located at 2593 W 12270 S, Riverton, UT 84065 and is currently estimated at $555,425, approximately $501 per square foot. 2593 W 12270 S is a home located in Salt Lake County with nearby schools including Rosamond Elementary School, Oquirrh Hills Middle School, and Riverton High School.
Ownership History
Date
Name
Owned For
Owner Type
Purchase Details
Closed on
Oct 11, 2023
Sold by
Nielsen Royce P and Nielsen Darna Dee
Bought by
Nielsen
Current Estimated Value
Home Financials for this Owner
Home Financials are based on the most recent Mortgage that was taken out on this home.
Original Mortgage
$17,000
Outstanding Balance
$14,610
Interest Rate
7.18%
Mortgage Type
New Conventional
Estimated Equity
$540,815
Purchase Details
Closed on
May 3, 2017
Sold by
Nielsen Royce P and Nielsen Darna Dee
Bought by
Nielsen Royce P and Nielsen Darna Dee
Create a Home Valuation Report for This Property
The Home Valuation Report is an in-depth analysis detailing your home's value as well as a comparison with similar homes in the area
Home Values in the Area
Average Home Value in this Area
Purchase History
| Date | Buyer | Sale Price | Title Company |
|---|---|---|---|
| Nielsen | -- | First American Title | |
| Nielsen Royce P | -- | First American Title | |
| Nielsen Royce P | -- | None Available |
Source: Public Records
Mortgage History
| Date | Status | Borrower | Loan Amount |
|---|---|---|---|
| Open | Nielsen Royce P | $17,000 |
Source: Public Records
Tax History Compared to Growth
Tax History
| Year | Tax Paid | Tax Assessment Tax Assessment Total Assessment is a certain percentage of the fair market value that is determined by local assessors to be the total taxable value of land and additions on the property. | Land | Improvement |
|---|---|---|---|---|
| 2025 | $2,763 | $487,900 | $260,600 | $227,300 |
| 2024 | $2,763 | $478,200 | $236,500 | $241,700 |
| 2023 | $2,897 | $472,700 | $234,200 | $238,500 |
| 2022 | $2,874 | $460,000 | $229,600 | $230,400 |
| 2021 | $2,426 | $345,800 | $148,900 | $196,900 |
| 2020 | $2,360 | $313,600 | $148,900 | $164,700 |
| 2019 | $2,335 | $305,000 | $148,900 | $156,100 |
| 2018 | $2,160 | $277,800 | $139,000 | $138,800 |
| 2017 | $1,850 | $231,900 | $139,000 | $92,900 |
| 2016 | $1,944 | $233,800 | $139,000 | $94,800 |
| 2015 | $2,058 | $240,000 | $137,700 | $102,300 |
| 2014 | $1,980 | $226,300 | $131,100 | $95,200 |
Source: Public Records
Map
Nearby Homes
- 12501 Falls Creek Rd
- 2356 W Montcalm Dr
- 2853 W 12075 S
- 12658 Old Fort Cir
- 2295 W Myers Ln
- 11788 S Myers Park Ln Unit 101
- 2511 W 11730 S
- 11716 S 2610 W
- 12034 S 1900 W
- 11707 S Myers Park Ln Unit 111
- 2626 W Midas Side Way
- 2602 W 11625 S
- 12900 S 2200 W
- 12580 S Janice Dr
- 3168 Chalk Creek Way
- 12317 S Redwood Rd
- 12875 S Aspen Glen Cir
- 12325 S Redwood Rd
- 12345 S Redwood Rd
- 1661 W Madison View Dr