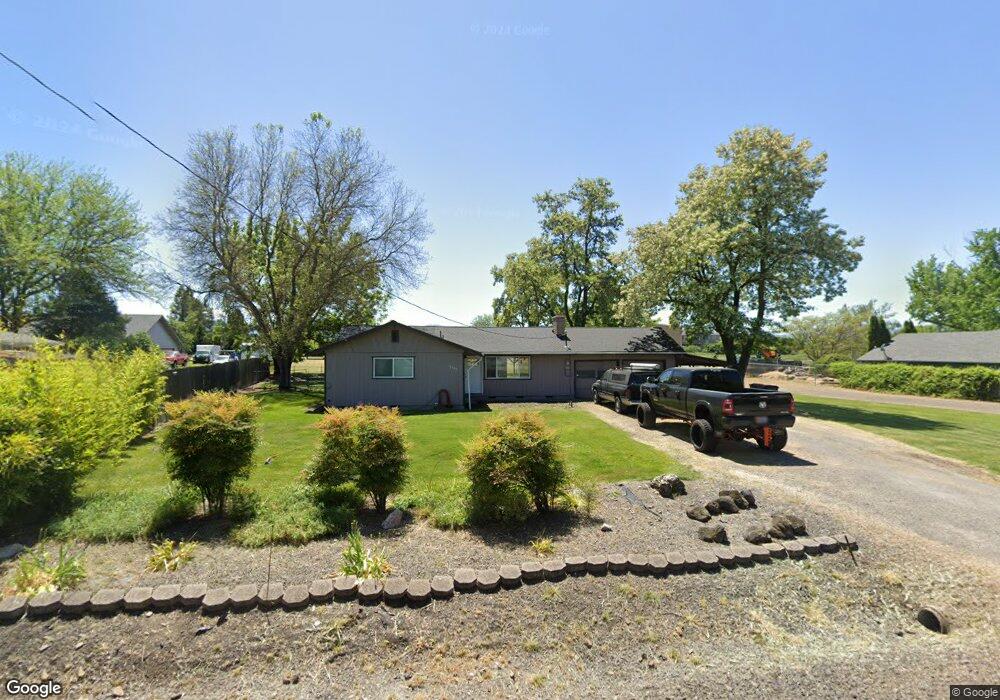
2594 Lotus Ln Central Point, OR 97502
Estimated Value: $351,075 - $379,000
3
Beds
2
Baths
1,197
Sq Ft
$306/Sq Ft
Est. Value
About This Home
This home is located at 2594 Lotus Ln, Central Point, OR 97502 and is currently estimated at $366,358, approximately $306 per square foot. 2594 Lotus Ln is a home located in Jackson County with nearby schools including Kennedy Elementary School, Hedrick Middle School, and North Medford High School.
Ownership History
Date
Name
Owned For
Owner Type
Purchase Details
Closed on
May 18, 2020
Sold by
Weeks Ronda
Bought by
Lumsden Kyle and Lumsden Kierra
Current Estimated Value
Home Financials for this Owner
Home Financials are based on the most recent Mortgage that was taken out on this home.
Original Mortgage
$229,995
Outstanding Balance
$203,807
Interest Rate
3.3%
Mortgage Type
New Conventional
Estimated Equity
$162,551
Purchase Details
Closed on
Oct 17, 2001
Sold by
Weeks Steven W
Bought by
Weeks Steven W and Weeks Ronda
Home Financials for this Owner
Home Financials are based on the most recent Mortgage that was taken out on this home.
Original Mortgage
$87,000
Interest Rate
6.88%
Purchase Details
Closed on
Oct 8, 2001
Sold by
Weeks Ronda
Bought by
Weeks Steven W
Home Financials for this Owner
Home Financials are based on the most recent Mortgage that was taken out on this home.
Original Mortgage
$87,000
Interest Rate
6.88%
Create a Home Valuation Report for This Property
The Home Valuation Report is an in-depth analysis detailing your home's value as well as a comparison with similar homes in the area
Home Values in the Area
Average Home Value in this Area
Purchase History
| Date | Buyer | Sale Price | Title Company |
|---|---|---|---|
| Lumsden Kyle | $242,100 | First American | |
| Weeks Steven W | -- | Key Title Company | |
| Weeks Steven W | -- | Key Title Company |
Source: Public Records
Mortgage History
| Date | Status | Borrower | Loan Amount |
|---|---|---|---|
| Open | Lumsden Kyle | $229,995 | |
| Previous Owner | Weeks Steven W | $87,000 |
Source: Public Records
Tax History Compared to Growth
Tax History
| Year | Tax Paid | Tax Assessment Tax Assessment Total Assessment is a certain percentage of the fair market value that is determined by local assessors to be the total taxable value of land and additions on the property. | Land | Improvement |
|---|---|---|---|---|
| 2025 | $2,090 | $168,660 | $80,210 | $88,450 |
| 2024 | $2,090 | $163,750 | $114,100 | $49,650 |
| 2023 | $2,025 | $158,990 | $110,790 | $48,200 |
| 2022 | $1,977 | $158,990 | $110,790 | $48,200 |
| 2021 | $1,927 | $154,360 | $107,560 | $46,800 |
| 2020 | $1,882 | $149,870 | $104,430 | $45,440 |
| 2019 | $1,839 | $141,280 | $98,450 | $42,830 |
| 2018 | $1,792 | $137,170 | $95,590 | $41,580 |
| 2017 | $1,763 | $137,170 | $95,590 | $41,580 |
| 2016 | $1,730 | $129,310 | $90,120 | $39,190 |
| 2015 | $1,657 | $129,310 | $90,120 | $39,190 |
| 2014 | $1,633 | $121,900 | $84,960 | $36,940 |
Source: Public Records
Map
Nearby Homes
- 6348 Crater Lake Hwy
- 2507 Agate Meadows
- 2956 Agate Meadows Cir
- 1729 E Gregory Rd
- 3131 Avenue A
- 7573 24th St
- 3228 Ramie Ln
- 2618 Carr St
- 1182 E Justice Rd
- 7635 Coloma St
- 7689 Calaveras St
- 2909 Ingalls Dr
- 1816 E Vilas Rd
- 5011 Highway 62
- 3420 Sonny Way
- 3432 Sonny Way
- 3444 Sonny Way Unit lots 30-41
- 3732 Agate Meadows Ct
- 3426 Sharon Way
- 3775 Agate Meadows Ct