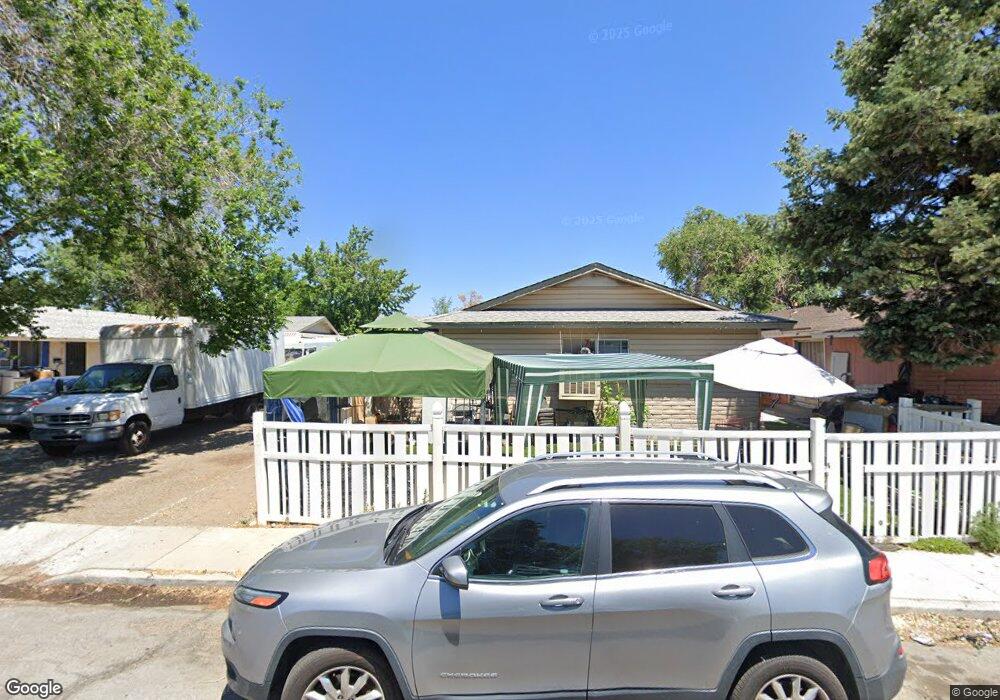
2595 & 2597 W Cygnet Cir Sparks, NV 89431
Downtown Sparks NeighborhoodEstimated Value: $429,708 - $630,000
5
Beds
2
Baths
1,896
Sq Ft
$283/Sq Ft
Est. Value
About This Home
This home is located at 2595 & 2597 W Cygnet Cir, Sparks, NV 89431 and is currently estimated at $536,903, approximately $283 per square foot. 2595 & 2597 W Cygnet Cir is a home located in Washoe County with nearby schools including Bernice Mathews Elementary School, Fred W. Traner Middle School, and Procter R. Hug High School.
Ownership History
Date
Name
Owned For
Owner Type
Purchase Details
Closed on
May 14, 2015
Sold by
Campos Jesus
Bought by
The Jian S Xie And Carina Yan 2004 Trust
Current Estimated Value
Purchase Details
Closed on
Sep 25, 2006
Sold by
Campos Jesus J
Bought by
Campos Jesus
Home Financials for this Owner
Home Financials are based on the most recent Mortgage that was taken out on this home.
Original Mortgage
$198,000
Interest Rate
7.75%
Mortgage Type
New Conventional
Purchase Details
Closed on
Jun 15, 2001
Sold by
Mynatt Robert G and Mynatt Nora
Bought by
Campos Jesus J
Home Financials for this Owner
Home Financials are based on the most recent Mortgage that was taken out on this home.
Original Mortgage
$107,910
Interest Rate
9.62%
Purchase Details
Closed on
Jun 11, 2001
Sold by
Salas Erika
Bought by
Campos Jesus S
Home Financials for this Owner
Home Financials are based on the most recent Mortgage that was taken out on this home.
Original Mortgage
$107,910
Interest Rate
9.62%
Create a Home Valuation Report for This Property
The Home Valuation Report is an in-depth analysis detailing your home's value as well as a comparison with similar homes in the area
Home Values in the Area
Average Home Value in this Area
Purchase History
| Date | Buyer | Sale Price | Title Company |
|---|---|---|---|
| The Jian S Xie And Carina Yan 2004 Trust | $135,000 | First American Title Reno | |
| Campos Jesus | -- | Western Title Incorporated | |
| Campos Jesus J | $120,000 | Western Title Inc | |
| Campos Jesus S | -- | Western Title Inc |
Source: Public Records
Mortgage History
| Date | Status | Borrower | Loan Amount |
|---|---|---|---|
| Previous Owner | Campos Jesus | $198,000 | |
| Previous Owner | Campos Jesus J | $107,910 |
Source: Public Records
Tax History Compared to Growth
Tax History
| Year | Tax Paid | Tax Assessment Tax Assessment Total Assessment is a certain percentage of the fair market value that is determined by local assessors to be the total taxable value of land and additions on the property. | Land | Improvement |
|---|---|---|---|---|
| 2025 | $1,285 | $63,371 | $41,720 | $21,651 |
| 2024 | $1,248 | $60,328 | $38,710 | $21,618 |
| 2023 | $1,248 | $59,054 | $39,305 | $19,749 |
| 2022 | $1,212 | $50,503 | $32,865 | $17,638 |
| 2021 | $1,177 | $43,574 | $25,375 | $18,199 |
| 2020 | $1,163 | $45,093 | $26,250 | $18,843 |
| 2019 | $1,108 | $41,252 | $22,470 | $18,782 |
| 2018 | $1,076 | $33,987 | $15,190 | $18,797 |
| 2017 | $1,043 | $33,106 | $14,000 | $19,106 |
| 2016 | $1,018 | $31,197 | $11,200 | $19,997 |
| 2015 | $257 | $28,807 | $8,050 | $20,757 |
| 2014 | $2,204 | $27,150 | $7,000 | $20,150 |
| 2013 | -- | $26,314 | $6,160 | $20,154 |
Source: Public Records
Map
Nearby Homes
- 2335 Roundhouse Rd
- 2380 Roundhouse Rd
- 2385 Pauline Ave
- 135 Carnation Ln
- 2136 Roundhouse Rd
- 168 Poppy Ln
- 113 Lilac Ln
- 2168 Cannonball Rd
- 112 Lilac Ln
- 2301 Oddie Blvd Unit 56
- 2301 Oddie Blvd Unit 162
- 2301 Oddie Blvd Unit 18
- 1990 Trainer Way
- 1885 Castle Way
- 1889 Merchant St
- 1841 Merchant St
- 1756 I St
- 1830 C St
- 2602 Fanto Ct Unit 17
- 1855 Verano Dr
- 2595 W Cygnet Cir
- 2591 E Cygnet Cir
- 2599 W Cygnet Cir
- 2587 E Cygnet Cir
- 2603 W Cygnet Cir
- 2594 E Cygnet Cir
- 2610 W Cygnet Cir
- 2583 E Cygnet Cir
- 2583 E Cygnet Cir Unit 2583,2585
- 2590 E Cygnet Cir
- 2607 W Cygnet Cir
- 2581 E Cygnet Cir
- 2611 W Cygnet Cir
- 2618 W Cygnet Cir
- 2566 E Cygnet Cir Unit 2566, 2568
- 2566 E Cygnet Cir
- 2579 E Cygnet Cir
- 2615 W Cygnet Cir
- 2575 E Cygnet Cir
- 2575/2577 Cygnet