2595 Maple St San Bernardino, CA 92410
Terrace NeighborhoodEstimated Value: $495,611 - $541,000
About This Home
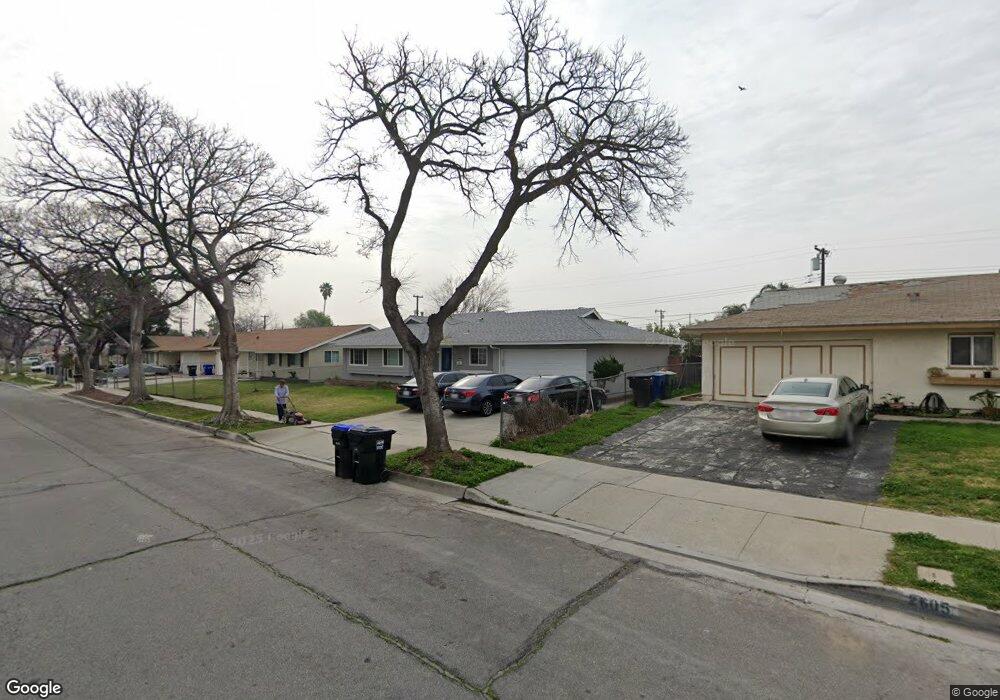
This home is located at 2595 Maple St, San Bernardino, CA 92410 and is currently estimated at $524,903, approximately $433 per square foot. 2595 Maple St is a home located in San Bernardino County with nearby schools including Myers Elementary School, Frisbie Middle School, and Eisenhower High School.
Ownership History
We collect this data history from publicly available records. To have your information removed, we recommend requesting removal directly through your county’s website.
Purchase Details
Home Financials for this Owner
Home Financials are based on the most recent Mortgage that was taken out on this home.Purchase Details
Home Financials for this Owner
Home Financials are based on the most recent Mortgage that was taken out on this home.Purchase Details
Home Values in the Area
Average Home Value in this Area
Purchase History
We collect this data history from publicly available records. To have your information removed, we recommend requesting removal directly through your county’s website.
| Date | Buyer | Sale Price | Title Company |
|---|---|---|---|
| -- | Old Republic Title | ||
| -- | Old Republic Title | ||
| -- | None Available |
Mortgage History
We collect this data history from publicly available records. To have your information removed, we recommend requesting removal directly through your county’s website.
| Date | Status | Borrower | Loan Amount |
|---|---|---|---|
| Open | $196,377 |
Tax History
We collect this data history from publicly available records. To have your information removed, we recommend requesting removal directly through your county’s website.
| Year | Tax Paid | Tax Assessment Tax Assessment Total Assessment is a certain percentage of the fair market value that is determined by local assessors to be the total taxable value of land and additions on the property. | Land | Improvement |
|---|---|---|---|---|
| 2025 | $1,535 | $116,233 | $27,471 | $88,762 |
| 2024 | $1,480 | $113,954 | $26,932 | $87,022 |
| 2023 | $1,561 | $111,720 | $26,404 | $85,316 |
| 2022 | $1,454 | $109,529 | $25,886 | $83,643 |
| 2021 | $1,439 | $107,381 | $25,378 | $82,003 |
| 2020 | $1,442 | $106,280 | $25,118 | $81,162 |
| 2019 | $1,411 | $104,196 | $24,625 | $79,571 |
| 2018 | $1,372 | $102,153 | $24,142 | $78,011 |
| 2017 | $1,356 | $100,150 | $23,669 | $76,481 |
| 2016 | $1,337 | $98,186 | $23,205 | $74,981 |
| 2015 | $1,192 | $96,711 | $22,856 | $73,855 |
| 2014 | $1,119 | $94,816 | $22,408 | $72,408 |
Map
- 2495 Etiwanda Ave
- 724 N Dallas Ave
- 2795 W Victoria St
- 1010 Terrace Rd Unit 24
- 1010 Terrace Rd Unit 185
- 1010 Terrace Rd
- 1010 Terrace Rd Unit 142
- 2423 W 7th St
- 559 N Marvin Dr
- 818 Terrace Rd
- 1140 N Belden Ave
- 2826 Spruce St
- 2271 W 7th St
- 1149 N Birch Ave
- 2280 Kyla Ct
- 555 N Chestnut Ave
- 2505 W E Foothill Blvd Unit 231
- 866 N Eucalyptus Ave
- 933 N Pine Ave
- 1252 N Mulberry Ave
- 2635 Maple St
- 2619 W Maple St
- 2619 Maple St
- 2649 Maple St
- 2634 Etiwanda Ave
- 2618 Etiwanda Ave
- 2648 Etiwanda Ave
- 2605 Maple St
- 2665 Maple St
- 841 N Marvin Dr
- 2620 Maple St
- 2604 Etiwanda Ave
- 2664 Etiwanda Ave
- 2679 Maple St
- 2672 Maple St
- 2594 Etiwanda Ave
- 2596 Maple St
- 2619 Union St
- 860 N Marvin Dr
- 2625 Etiwanda Ave
Ask me questions while you tour the home.