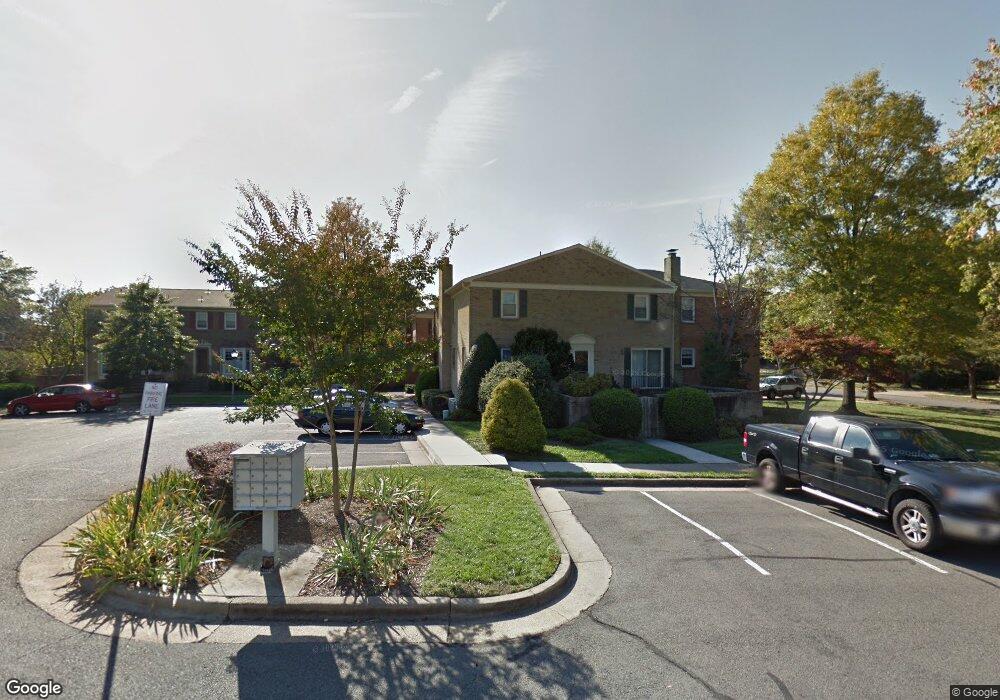
2596 Nicky Ln Unit 96 Alexandria, VA 22311
Alexandria West NeighborhoodEstimated Value: $615,000 - $637,000
2
Beds
4
Baths
1,360
Sq Ft
$462/Sq Ft
Est. Value
About This Home
This home is located at 2596 Nicky Ln Unit 96, Alexandria, VA 22311 and is currently estimated at $627,652, approximately $461 per square foot. 2596 Nicky Ln Unit 96 is a home located in Alexandria City with nearby schools including John Adams Elementary School, Francis C. Hammond Middle, and Alexandria City High School.
Ownership History
Date
Name
Owned For
Owner Type
Purchase Details
Closed on
Jul 22, 2019
Sold by
Sclater Elizabeth Anne
Bought by
Lehner Michael
Current Estimated Value
Home Financials for this Owner
Home Financials are based on the most recent Mortgage that was taken out on this home.
Original Mortgage
$494,763
Outstanding Balance
$433,457
Interest Rate
3.82%
Mortgage Type
VA
Estimated Equity
$194,195
Purchase Details
Closed on
Jan 29, 2010
Sold by
Self Lorraine
Bought by
Sclater Elizabeth A
Home Financials for this Owner
Home Financials are based on the most recent Mortgage that was taken out on this home.
Original Mortgage
$210,000
Interest Rate
4.95%
Mortgage Type
New Conventional
Create a Home Valuation Report for This Property
The Home Valuation Report is an in-depth analysis detailing your home's value as well as a comparison with similar homes in the area
Home Values in the Area
Average Home Value in this Area
Purchase History
| Date | Buyer | Sale Price | Title Company |
|---|---|---|---|
| Lehner Michael | $497,000 | Universal Title | |
| Sclater Elizabeth A | $410,000 | -- |
Source: Public Records
Mortgage History
| Date | Status | Borrower | Loan Amount |
|---|---|---|---|
| Open | Lehner Michael | $494,763 | |
| Previous Owner | Sclater Elizabeth A | $210,000 |
Source: Public Records
Tax History Compared to Growth
Tax History
| Year | Tax Paid | Tax Assessment Tax Assessment Total Assessment is a certain percentage of the fair market value that is determined by local assessors to be the total taxable value of land and additions on the property. | Land | Improvement |
|---|---|---|---|---|
| 2025 | $7,231 | $588,270 | $280,750 | $307,520 |
| 2024 | $7,231 | $581,307 | $278,000 | $303,307 |
| 2023 | $6,299 | $567,462 | $272,580 | $294,882 |
| 2022 | $6,152 | $554,207 | $264,641 | $289,566 |
| 2021 | $5,972 | $537,982 | $256,933 | $281,049 |
| 2020 | $5,724 | $479,163 | $227,375 | $251,788 |
| 2019 | $5,093 | $450,695 | $212,500 | $238,195 |
| 2018 | $5,093 | $450,695 | $212,500 | $238,195 |
| 2017 | $4,840 | $428,308 | $199,500 | $228,808 |
| 2016 | $4,512 | $420,480 | $191,672 | $228,808 |
| 2015 | $4,588 | $439,868 | $197,600 | $242,268 |
| 2014 | $4,440 | $425,683 | $190,000 | $235,683 |
Source: Public Records
Map
Nearby Homes
- 5417 Gary Place
- 2643 Centennial Ct
- 2508 N Shelley St
- 5501 Seminary Rd Unit 804S
- 5505 Seminary Rd Unit 1608N
- 5505 Seminary Rd Unit 905N
- 5505 Seminary Rd Unit 2405N
- 3713 S George Mason Dr Unit 716
- 3713 S George Mason Dr Unit 904W
- 3713 S George Mason Dr Unit 1204W
- 3713 S George Mason Dr Unit T5
- 5817 Dawes Ave
- 4691 Longstreet Ln Unit 202
- 4688 Lawton Way Unit 3
- 3709 S George Mason Dr Unit 1203-E
- 3709 S George Mason Dr Unit T3E
- 3709 S George Mason Dr Unit 114
- 3709 S George Mason Dr Unit 1106 E
- 5565 Seminary Rd Unit 206
- 5565 Seminary Rd Unit 214
- 2596 Nicky Ln
- 2598 Nicky Ln
- 5418 Echols Ave
- 2594 Nicky Ln
- 5422 Echols Ave
- 2592 Nicky Ln
- 2588 Nicky Ln
- 2463 N Stevens St
- 2461 N Stevens St
- 2590 Nicky Ln
- 2586 Nicky Ln Unit 92
- 2586 Nicky Ln
- 2599 Nicky Ln
- 2580 Nicky Ln
- 2580 Nicky Ln Unit 91
- 2584 Nicky Ln
- 2578 Nicky Ln
- 2578 Nicky Ln Unit 90
- 5384 Echols Ave
- 5384 Echols Ave Unit 56