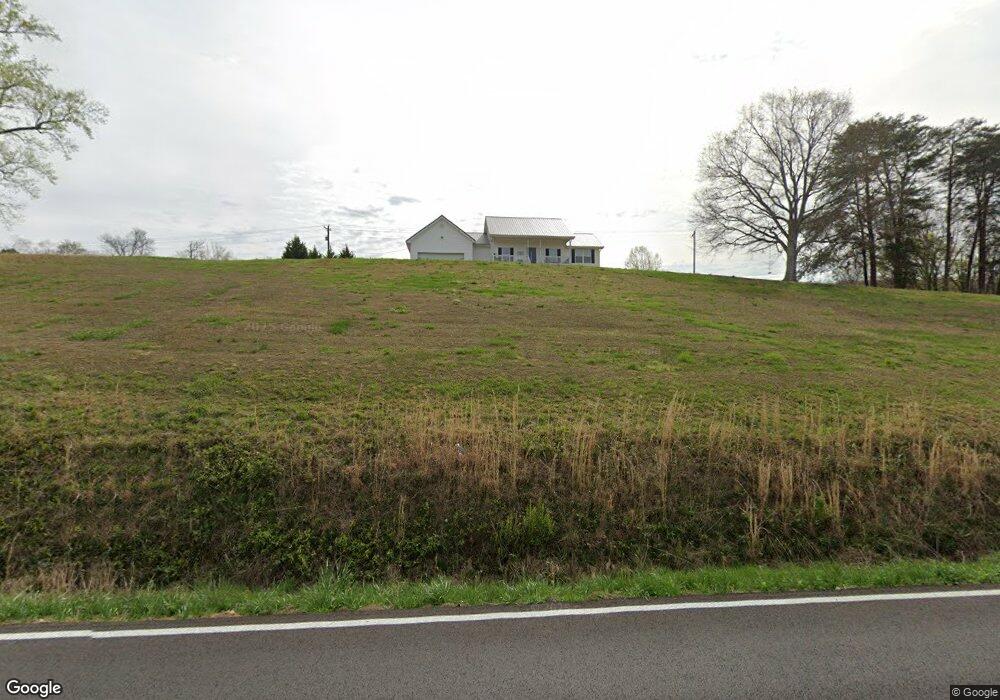
2598 Old Mineral Springs Rd La Fayette, GA 30728
Estimated Value: $230,937 - $283,000
--
Bed
2
Baths
1,526
Sq Ft
$165/Sq Ft
Est. Value
About This Home
This home is located at 2598 Old Mineral Springs Rd, La Fayette, GA 30728 and is currently estimated at $251,234, approximately $164 per square foot. 2598 Old Mineral Springs Rd is a home located in Walker County with nearby schools including Gilbert Elementary School, Lafayette Middle School, and Lafayette High School.
Ownership History
Date
Name
Owned For
Owner Type
Purchase Details
Closed on
Nov 17, 2021
Sold by
Spence Jacob Tyler
Bought by
Spence Jacob and Spence Amanda
Current Estimated Value
Home Financials for this Owner
Home Financials are based on the most recent Mortgage that was taken out on this home.
Original Mortgage
$145,600
Outstanding Balance
$133,021
Interest Rate
3.09%
Mortgage Type
New Conventional
Estimated Equity
$118,213
Purchase Details
Closed on
May 4, 2020
Sold by
Mullaly Jay
Bought by
Spence Jacob Tyler
Home Financials for this Owner
Home Financials are based on the most recent Mortgage that was taken out on this home.
Original Mortgage
$105,061
Interest Rate
3.12%
Mortgage Type
FHA
Purchase Details
Closed on
Nov 8, 2004
Sold by
Leming Michael and Leming Judy
Bought by
Mullaly Jay & Diana Michelle
Purchase Details
Closed on
Mar 22, 1991
Bought by
Leming Michael and Leming Judy
Create a Home Valuation Report for This Property
The Home Valuation Report is an in-depth analysis detailing your home's value as well as a comparison with similar homes in the area
Home Values in the Area
Average Home Value in this Area
Purchase History
| Date | Buyer | Sale Price | Title Company |
|---|---|---|---|
| Spence Jacob | -- | -- | |
| Spence Jacob Tyler | $107,000 | -- | |
| Mullaly Jay & Diana Michelle | -- | -- | |
| Leming Michael | -- | -- |
Source: Public Records
Mortgage History
| Date | Status | Borrower | Loan Amount |
|---|---|---|---|
| Open | Spence Jacob | $145,600 | |
| Previous Owner | Spence Jacob Tyler | $105,061 |
Source: Public Records
Tax History Compared to Growth
Tax History
| Year | Tax Paid | Tax Assessment Tax Assessment Total Assessment is a certain percentage of the fair market value that is determined by local assessors to be the total taxable value of land and additions on the property. | Land | Improvement |
|---|---|---|---|---|
| 2024 | $1,955 | $85,706 | $8,392 | $77,314 |
| 2023 | $1,872 | $80,010 | $6,661 | $73,349 |
| 2022 | $1,668 | $65,195 | $1,859 | $63,336 |
| 2021 | $1,254 | $52,864 | $1,859 | $51,005 |
| 2020 | $1,227 | $42,251 | $1,859 | $40,392 |
| 2019 | $1,248 | $42,251 | $1,859 | $40,392 |
| 2018 | $1,118 | $42,251 | $1,859 | $40,392 |
| 2017 | $1,365 | $42,251 | $1,859 | $40,392 |
| 2016 | $1,115 | $42,251 | $1,859 | $40,392 |
| 2015 | $1,265 | $45,587 | $2,324 | $43,263 |
| 2014 | $1,165 | $45,587 | $2,324 | $43,263 |
| 2013 | -- | $45,587 | $2,324 | $43,263 |
Source: Public Records
Map
Nearby Homes
- 329 Windsong Dr
- 1309 Campbell Crescent
- 1303 Campbell Crescent
- 1314 Fernwood Dr
- 1129 Probasco St N
- 393 Wisteria Rd
- 79 Hobart Ln
- 307 Ridgecrest Dr
- 1876 Old Mineral Springs Rd
- 1118 Probasco St N
- 302 Ridgecrest Dr
- 1403 N Main St
- 105 Stanfield Rd
- 1520 N Main St
- 1001 N Main St
- 0 N Highway 27 Unit RTC2680391
- 0 N Highway 27 Unit 1395752
- 71 McCarter Rd
- 0 Twin Lakes Rd
- 111 Dove Dr
- 2596 Old Mineral Springs Rd
- 0 Old Mineral Springs Rd Unit RTC2805073
- 0 Old Mineral Springs Rd Unit 1398421
- 0 Old Mineral Springs Rd Unit 10286052
- 0 Old Mineral Springs Rd Unit 1390712
- 0 Old Mineral Springs Rd Unit 120223
- 0 Old Mineral Springs Rd Unit 1080421
- 0 Old Mineral Springs Rd Unit 1002376
- 0 Old Mineral Springs Rd
- 2740 Old Mineral Springs Rd
- 2740 Old Mineral Springs Rd
- 2776 Old Mineral Springs Rd
- 2534 Old Mineral Springs Rd
- 2457 Old Mineral Springs Rd
- 2747 Old Mineral Springs Rd
- 2749 Old Mineral Springs Rd
- 2916 Old Mineral Springs Rd
- 2916 Old Mineral Springs Rd
- 2472 Old Mineral Springs Rd
- 2314 Old Mineral Springs Rd