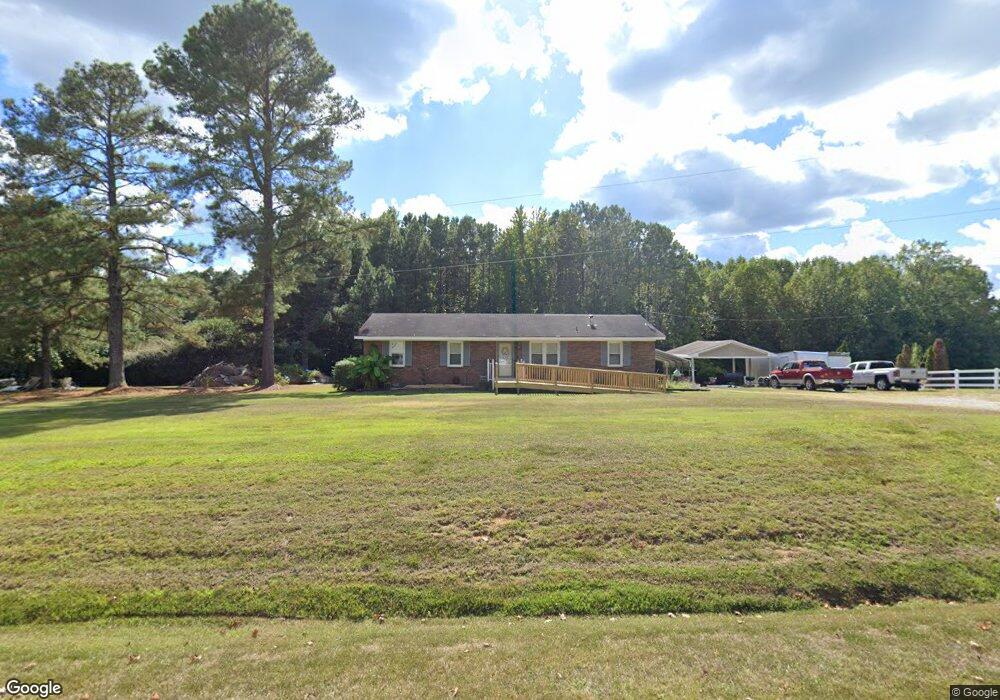
2598 Spring Hill Rd Spring Hope, NC 27882
Estimated Value: $234,370 - $341,000
3
Beds
3
Baths
1,000
Sq Ft
$281/Sq Ft
Est. Value
About This Home
This home is located at 2598 Spring Hill Rd, Spring Hope, NC 27882 and is currently estimated at $281,343, approximately $281 per square foot. 2598 Spring Hill Rd is a home located in Nash County with nearby schools including Spring Hope Elementary School, Southern Nash Middle School, and Southern Nash High School.
Ownership History
Date
Name
Owned For
Owner Type
Purchase Details
Closed on
Oct 13, 2021
Sold by
Denton Willie Nick and Denton Margie Faye
Bought by
Lester Stephanie Denton
Current Estimated Value
Purchase Details
Closed on
Jun 1, 2011
Sold by
Hsbc Mortgage Services Inc
Bought by
Denton Willie Nick and Lester Stephanie Denton
Home Financials for this Owner
Home Financials are based on the most recent Mortgage that was taken out on this home.
Original Mortgage
$53,600
Interest Rate
4.65%
Mortgage Type
New Conventional
Purchase Details
Closed on
Mar 4, 2011
Sold by
Reams Gretchen W and Reams Brandon S
Bought by
Hsbc Mortgage Services Inc
Purchase Details
Closed on
Aug 25, 2006
Sold by
Whitley Gary Brent and Whitley Jane S
Bought by
Reams Brandon S and Reams Gretchen W
Home Financials for this Owner
Home Financials are based on the most recent Mortgage that was taken out on this home.
Original Mortgage
$150,000
Interest Rate
9.89%
Mortgage Type
Purchase Money Mortgage
Create a Home Valuation Report for This Property
The Home Valuation Report is an in-depth analysis detailing your home's value as well as a comparison with similar homes in the area
Purchase History
We collect this data history from publicly available records. To have your information removed, we recommend requesting removal directly through your county’s website.
| Date | Buyer | Sale Price | Title Company |
|---|---|---|---|
| Lester Stephanie Denton | -- | None Available | |
| Denton Willie Nick | $67,000 | None Available | |
| Hsbc Mortgage Services Inc | $100,687 | None Available | |
| Reams Brandon S | $150,000 | None Available |
Source: Public Records
Mortgage History
We collect this data history from publicly available records. To have your information removed, we recommend requesting removal directly through your county’s website.
| Date | Status | Borrower | Loan Amount |
|---|---|---|---|
| Previous Owner | Denton Willie Nick | $53,600 | |
| Previous Owner | Reams Brandon S | $150,000 |
Source: Public Records
Tax History
| Year | Tax Paid | Tax Assessment Tax Assessment Total Assessment is a certain percentage of the fair market value that is determined by local assessors to be the total taxable value of land and additions on the property. | Land | Improvement |
|---|---|---|---|---|
| 2025 | $1,396 | $147,710 | $26,400 | $121,310 |
| 2024 | $1,336 | $105,750 | $26,400 | $79,350 |
| 2023 | $1,073 | $105,750 | $0 | $0 |
| 2022 | $1,073 | $105,750 | $26,400 | $79,350 |
| 2021 | $1,073 | $105,750 | $26,400 | $79,350 |
| 2020 | $875 | $105,750 | $26,400 | $79,350 |
| 2019 | $1,073 | $105,750 | $26,400 | $79,350 |
| 2018 | $1,072 | $105,750 | $0 | $0 |
| 2017 | $936 | $106,750 | $0 | $0 |
| 2015 | $936 | $106,750 | $0 | $0 |
| 2014 | $907 | $106,750 | $0 | $0 |
Source: Public Records
Map
Nearby Homes
- 2321 Peachtree Hills Rd
- 2275 Peachtree Hills Rd
- 2251 Peachtree Hills Rd
- 8555 Savage Rd
- 30 Sunrise Ct
- 40 Morning Dew Way
- Lot 4 Arthur Wilder Rd
- Lot 1 Arthur Wilder Rd
- Lot 5 Arthur Wilder Rd
- Lot 2 Arthur Wilder Rd
- Lot 3 Arthur Wilder Rd
- 0 Stallings Rd Unit LotWP001
- 00 Seven Paths Rd
- 2781 N Carolina 581 Hwy
- 2379 Peachtree Hills Rd
- 2345 Peachtree Hills Rd
- 10650 Stallings Rd
- 1978 Hayes Rd Unit 1978
- 1960 Hayes Rd Unit Lot 9
- 1960 Hayes Rd
- Lot 10 Spring Hill Rd
- 0000 Spring Hill Rd
- 000 Spring Hill Rd
- 00 Spring Hill Rd
- 0 Spring Hill Rd
- 2574 Spring Hill Rd
- 2665 Spring Hill Rd
- 2625 Spring Hill Rd
- 2579 Spring Hill Rd
- 2738 Spring Hill Rd
- 2760 Spring Hill Rd
- 2561 Spring Hill Rd
- 2551 Spring Hill Rd
- 2271 Spring Hill Rd
- 2143 Spring Hill Rd
- 2152 Spring Hill Rd
- 2060 Spring Hill Rd
- 10356 Seven Paths Rd
- 10380 Seven Paths Rd
- 10239 Seven Paths Rd
Your Personal Tour Guide
Ask me questions while you tour the home.