Estimated Value: $246,290 - $486,000
--
Bed
3
Baths
2,322
Sq Ft
$142/Sq Ft
Est. Value
About This Home
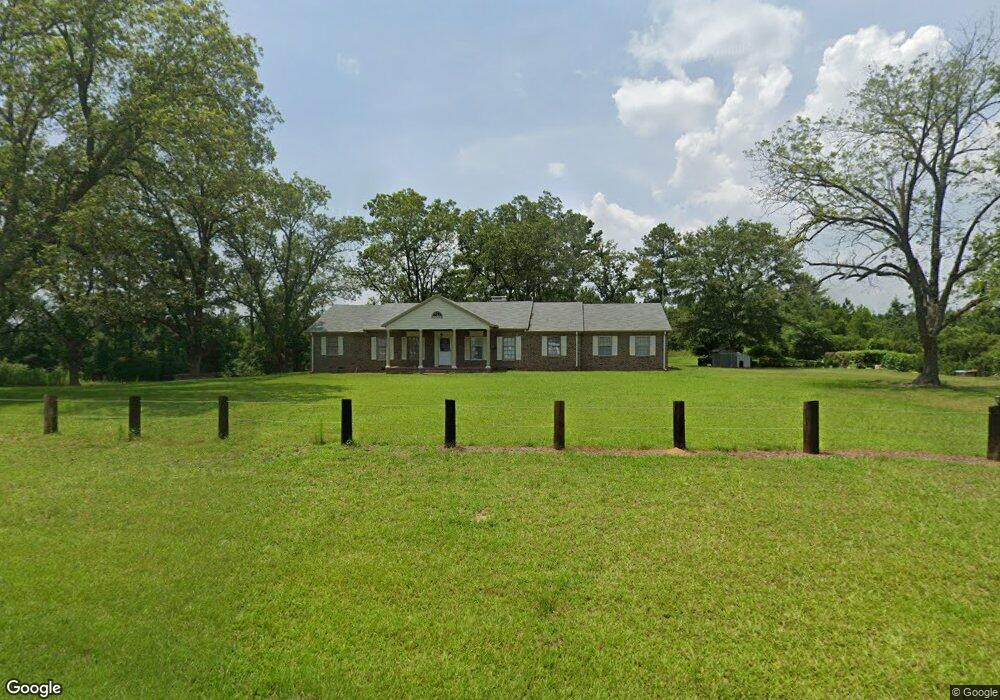
This home is located at 2599 Marvis Chapman Rd, Ideal, GA 31041 and is currently estimated at $330,097, approximately $142 per square foot. 2599 Marvis Chapman Rd is a home located in Macon County with nearby schools including Macon County Elementary School, Macon County Middle School, and Macon County High School.
Ownership History
Date
Name
Owned For
Owner Type
Purchase Details
Closed on
Apr 28, 2025
Sold by
Ho My Dung
Bought by
Columbia Farms Of Georgia Inc
Current Estimated Value
Purchase Details
Closed on
Dec 22, 2020
Sold by
Fredebeil Pamela Studdard
Bought by
Nations James Martin and Frye Nations Andrea Nichole
Purchase Details
Closed on
Sep 5, 2019
Sold by
Fredebeil Pamela S
Bought by
Nguyen Van and Tran Kevin
Purchase Details
Closed on
Sep 11, 2018
Sold by
Thomas Laquita C
Bought by
Fredebeil Pamela S and S L Thomas Irrev Tr
Purchase Details
Closed on
May 30, 2018
Sold by
Thomas Laquita C
Bought by
Ho My Dung
Purchase Details
Closed on
Nov 27, 1990
Bought by
Thomas Laquita C
Create a Home Valuation Report for This Property
The Home Valuation Report is an in-depth analysis detailing your home's value as well as a comparison with similar homes in the area
Home Values in the Area
Average Home Value in this Area
Purchase History
| Date | Buyer | Sale Price | Title Company |
|---|---|---|---|
| Columbia Farms Of Georgia Inc | $3,350,000 | -- | |
| Nations James Martin | $292,930 | -- | |
| Nguyen Van | $245,700 | -- | |
| Fredebeil Pamela S | -- | -- | |
| Ho My Dung | $330,000 | -- | |
| Thomas Laquita C | -- | -- |
Source: Public Records
Tax History Compared to Growth
Tax History
| Year | Tax Paid | Tax Assessment Tax Assessment Total Assessment is a certain percentage of the fair market value that is determined by local assessors to be the total taxable value of land and additions on the property. | Land | Improvement |
|---|---|---|---|---|
| 2024 | $2,460 | $87,619 | $8,000 | $79,619 |
| 2023 | $2,460 | $87,619 | $8,000 | $79,619 |
| 2022 | $1,825 | $65,007 | $8,000 | $57,007 |
| 2021 | $1,102 | $38,030 | $7,000 | $31,030 |
| 2020 | $1,102 | $38,030 | $7,000 | $31,030 |
| 2019 | $1,102 | $38,030 | $7,000 | $31,030 |
| 2018 | $1,106 | $38,030 | $7,000 | $31,030 |
| 2017 | $1,114 | $38,030 | $7,000 | $31,030 |
| 2016 | $1,115 | $38,030 | $7,000 | $31,030 |
| 2015 | -- | $40,994 | $7,000 | $33,994 |
| 2014 | -- | $40,994 | $7,000 | $33,994 |
| 2013 | -- | $40,994 | $7,000 | $33,994 |
Source: Public Records
Map
Nearby Homes
- 0 Marvis Chapman Rd Unit 10319071
- 0 Marvis Chapman Rd Unit 25510380
- 7522 Whitewater Rd
- 0 Southland Rd
- 93 Poole Rd
- Parcel 6 Carl Rogers Rd
- Parcel 13 Carl Rogers Rd
- Parcel 8 Carl Rogers Rd
- Parcel 5 Carl Rogers Rd
- Parcel 7 Carl Rogers Rd
- Parcel 12 Carl Rogers Rd
- 206 Southland Rd
- 831 Ga Highway 90 E
- Parcel 2 Whipporwill Rd
- Parcel 3 Whipporwill Rd
- Parcel 1 Whipporwill Rd
- 367 Georgia 127
- 257 Carpenter Rd
- 298 E Highway 127
- 708 Tommy Purvis Junior Rd
- 179 Pete Faulk Rd
- 1159 Little Bethel Rd
- 3098 Marvis Chapman Rd
- 2259 Layfield Rd
- 3201 Marvis Chapman Rd
- 642 Bethel Church Rd
- 854 Little Bethel Rd
- 419 Grandy Rogs Rd
- 830 Little Bethel Rd
- 0 Marvis Chapman Rd Unit 8437828
- 0 Marvis Chapman Rd Unit 8437846
- 0 Marvis Chapman Rd Unit 7611545
- 0 Marvis Chapman Rd Unit 8187045
- 0 Marvis Chapman Rd Unit 25510374
- 0 Marvis Chapman Rd Unit 24555197
- 0 Marvis Chapman Rd Unit 22292558
- 0 Marvis Chapman Rd Unit 22366880
- 0 Marvis Chapman Rd Unit 20148701
- 0 Marvis Chapman Rd Unit 8187025
- 0 Marvis Chapman Rd Unit 8826561