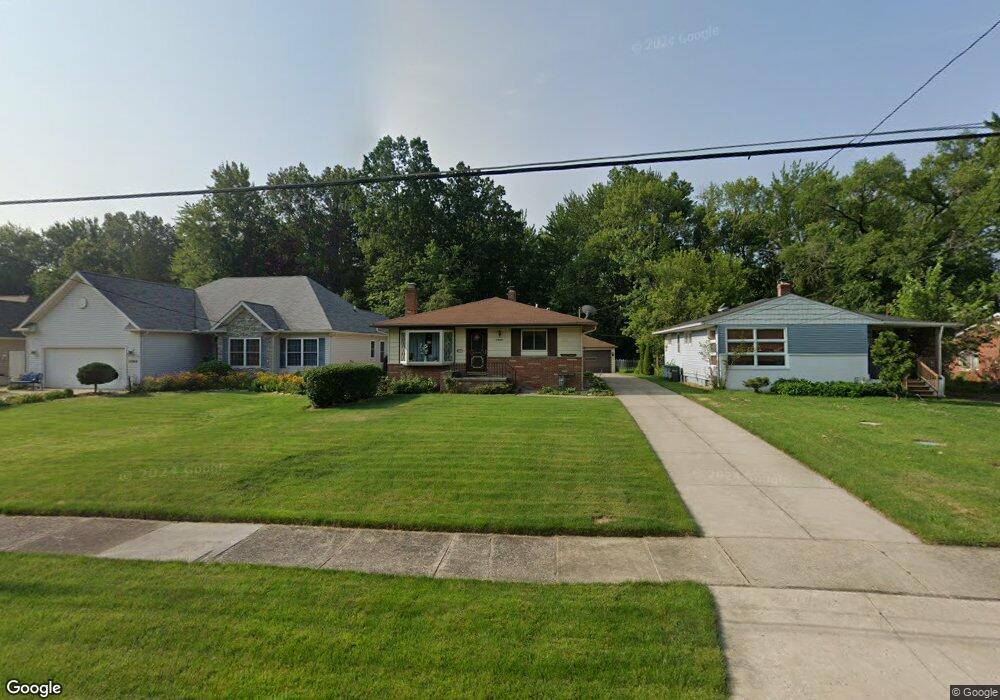
25997 Myrtle Ave Olmsted Falls, OH 44138
Estimated Value: $219,830 - $247,000
3
Beds
1
Bath
1,140
Sq Ft
$203/Sq Ft
Est. Value
About This Home
This home is located at 25997 Myrtle Ave, Olmsted Falls, OH 44138 and is currently estimated at $231,458, approximately $203 per square foot. 25997 Myrtle Ave is a home located in Cuyahoga County with nearby schools including Falls-Lenox Primary Elementary School, Olmsted Falls Intermediate Building, and Olmsted Falls Middle School.
Ownership History
Date
Name
Owned For
Owner Type
Purchase Details
Closed on
Jul 12, 2023
Sold by
Wilmink Family Trust
Bought by
Wilmink Gertrude L
Current Estimated Value
Purchase Details
Closed on
Aug 14, 2019
Sold by
Wilmink Donald E and Wilmink Gertrude L
Bought by
Wilmink Gertrude L and The Wilmink Family Trust
Purchase Details
Closed on
Nov 22, 2000
Sold by
Wilmink Donald E and Wilmink Gertrude L
Bought by
Wilmink Donald E and Wilmink Gertrude L
Purchase Details
Closed on
Apr 2, 1985
Sold by
Wilmink Donald E and Wilmink Gertrude
Bought by
Wilmink Donald E
Purchase Details
Closed on
Jan 1, 1975
Bought by
Wilmink Donald E and Wilmink Gertrude
Create a Home Valuation Report for This Property
The Home Valuation Report is an in-depth analysis detailing your home's value as well as a comparison with similar homes in the area
Home Values in the Area
Average Home Value in this Area
Purchase History
| Date | Buyer | Sale Price | Title Company |
|---|---|---|---|
| Wilmink Gertrude L | -- | None Listed On Document | |
| Wilmink Gertrude L | -- | None Available | |
| Wilmink Donald E | -- | -- | |
| Wilmink Donald E | -- | -- | |
| Wilmink Donald E | -- | -- |
Source: Public Records
Tax History Compared to Growth
Tax History
| Year | Tax Paid | Tax Assessment Tax Assessment Total Assessment is a certain percentage of the fair market value that is determined by local assessors to be the total taxable value of land and additions on the property. | Land | Improvement |
|---|---|---|---|---|
| 2024 | $4,733 | $73,115 | $9,800 | $63,315 |
| 2023 | $3,607 | $46,340 | $11,760 | $34,580 |
| 2022 | $3,045 | $46,340 | $11,760 | $34,580 |
| 2021 | $3,014 | $46,340 | $11,760 | $34,580 |
| 2020 | $2,887 | $40,670 | $10,330 | $30,350 |
| 2019 | $2,561 | $116,200 | $29,500 | $86,700 |
| 2018 | $2,557 | $40,670 | $10,330 | $30,350 |
| 2017 | $2,479 | $37,280 | $8,930 | $28,350 |
| 2016 | $2,465 | $37,280 | $8,930 | $28,350 |
| 2015 | $2,290 | $37,280 | $8,930 | $28,350 |
| 2014 | $2,290 | $34,510 | $8,260 | $26,250 |
Source: Public Records
Map
Nearby Homes
- 26033 Myrtle Ave
- 25969 Myrtle Ave
- 26063 Myrtle Ave
- 25955 Myrtle Ave
- 25941 Myrtle Ave
- 25927 Myrtle Ave
- 7659 Mapleway Dr
- 7671 Mapleway Dr
- 7647 Mapleway Dr
- 7683 Mapleway Dr
- 26070 Myrtle Ave
- 25982 Myrtle Ave
- 25913 Myrtle Ave
- 26064 Myrtle Ave
- 25896 Water St
- 7695 Mapleway Dr
- 25942 Myrtle Ave
- 7623 Mapleway Dr
- 25874 Water St
- 7611 Mapleway Dr