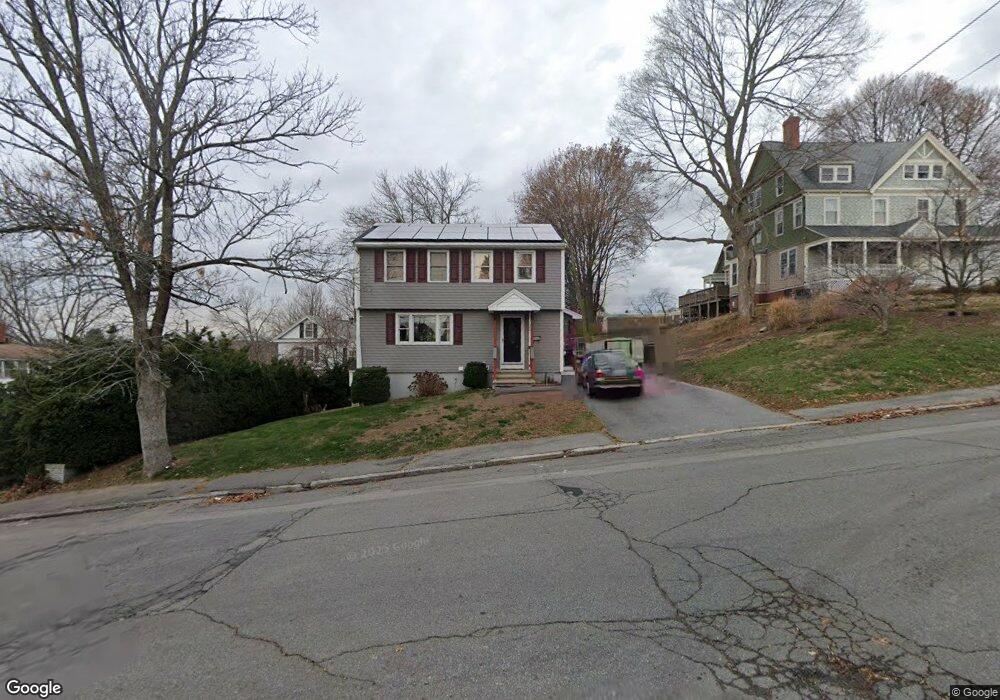
26 13th St Lowell, MA 01850
Centralville NeighborhoodEstimated Value: $448,000 - $521,547
3
Beds
2
Baths
1,466
Sq Ft
$327/Sq Ft
Est. Value
About This Home
This home is located at 26 13th St, Lowell, MA 01850 and is currently estimated at $479,637, approximately $327 per square foot. 26 13th St is a home located in Middlesex County with nearby schools including S. Christa McAuliffe Elementary School, Greenhalge Elementary School, and Moody Elementary School.
Ownership History
Date
Name
Owned For
Owner Type
Purchase Details
Closed on
Jul 26, 2012
Sold by
Kutsikos John P and Kutsikos Sandra R
Bought by
Kutsikos John P and Lebaropoulos Sandra R
Current Estimated Value
Home Financials for this Owner
Home Financials are based on the most recent Mortgage that was taken out on this home.
Original Mortgage
$15,000
Interest Rate
3.78%
Purchase Details
Closed on
Oct 5, 1998
Sold by
Otero Julio and Otero Lily
Bought by
Kutsikos John P and Kutsikos Sandra R
Home Financials for this Owner
Home Financials are based on the most recent Mortgage that was taken out on this home.
Original Mortgage
$116,750
Interest Rate
6.89%
Mortgage Type
Purchase Money Mortgage
Purchase Details
Closed on
Jan 28, 1993
Sold by
Tisdale Drive Corp
Bought by
Otero Julio and Otero Lily
Create a Home Valuation Report for This Property
The Home Valuation Report is an in-depth analysis detailing your home's value as well as a comparison with similar homes in the area
Home Values in the Area
Average Home Value in this Area
Purchase History
| Date | Buyer | Sale Price | Title Company |
|---|---|---|---|
| Kutsikos John P | -- | -- | |
| Kutsikos John P | -- | -- | |
| Kutsikos John P | $122,900 | -- | |
| Kutsikos John P | $122,900 | -- | |
| Otero Julio | $117,000 | -- | |
| Otero Julio | $117,000 | -- |
Source: Public Records
Mortgage History
| Date | Status | Borrower | Loan Amount |
|---|---|---|---|
| Closed | Kutsikos John P | $15,000 | |
| Previous Owner | Otero Julio | $116,750 | |
| Previous Owner | Otero Julio | $5,000 |
Source: Public Records
Tax History
| Year | Tax Paid | Tax Assessment Tax Assessment Total Assessment is a certain percentage of the fair market value that is determined by local assessors to be the total taxable value of land and additions on the property. | Land | Improvement |
|---|---|---|---|---|
| 2025 | $5,121 | $446,100 | $157,900 | $288,200 |
| 2024 | $5,189 | $435,700 | $147,500 | $288,200 |
| 2023 | $4,978 | $400,800 | $128,300 | $272,500 |
| 2022 | $4,445 | $350,300 | $116,600 | $233,700 |
| 2021 | $4,158 | $308,900 | $101,500 | $207,400 |
| 2020 | $3,838 | $287,300 | $88,700 | $198,600 |
| 2019 | $3,714 | $264,500 | $82,100 | $182,400 |
| 2018 | $3,583 | $249,000 | $78,200 | $170,800 |
| 2017 | $3,473 | $232,800 | $71,100 | $161,700 |
| 2016 | $3,503 | $231,100 | $69,400 | $161,700 |
| 2015 | $3,317 | $214,300 | $69,400 | $144,900 |
| 2013 | $3,182 | $212,000 | $81,100 | $130,900 |
Source: Public Records
Map
Nearby Homes
- 18 May St
- 26 July St
- 106 Methuen St Unit B
- 35 Whitney Ave Unit 33
- 97 Whitney Ave
- 1 19th St Unit 3
- 122 Beech St
- 15 Dana St
- 330 Christian St
- 73 W 4th St
- 272 W 6th St
- 27 Bunker Hill Ave
- 27-29 Fifth St
- 74 Aiken Ave
- 241 Humphrey St
- 349 Hildreth St Unit 16
- 306 Aiken Ave Unit 7
- 306 Aiken Ave Unit 16
- 25 Read St
- Lot 11 Christian St