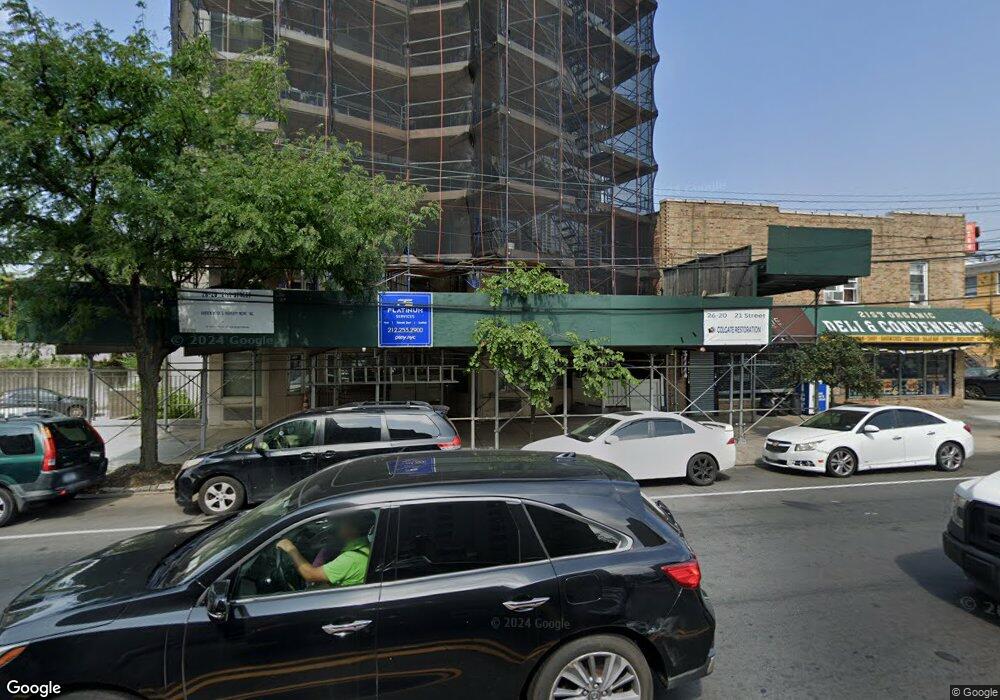
26-20 21st St Unit 6B Astoria, NY 11102
Astoria NeighborhoodEstimated Value: $634,000 - $725,000
1
Bed
1
Bath
760
Sq Ft
$893/Sq Ft
Est. Value
About This Home
This home is located at 26-20 21st St Unit 6B, Astoria, NY 11102 and is currently estimated at $678,670, approximately $892 per square foot. 26-20 21st St Unit 6B is a home located in Queens County with nearby schools including P.S. 017 Henry David Thoreau, I.S. 126Q Albert Shanker School Community School, and William Cullen Bryant High School.
Ownership History
Date
Name
Owned For
Owner Type
Purchase Details
Closed on
Dec 16, 2016
Sold by
Min Kyonghan and Min Byung Im
Bought by
O'Neill Brian William
Current Estimated Value
Home Financials for this Owner
Home Financials are based on the most recent Mortgage that was taken out on this home.
Original Mortgage
$452,000
Outstanding Balance
$365,544
Interest Rate
3.57%
Mortgage Type
Purchase Money Mortgage
Estimated Equity
$313,126
Purchase Details
Closed on
Jun 5, 2014
Sold by
Min Byung Im
Bought by
Min Byung Im and Min Kyonghan
Purchase Details
Closed on
Sep 28, 2010
Sold by
Sahara Realty Development Llc
Bought by
Min Byung Im
Home Financials for this Owner
Home Financials are based on the most recent Mortgage that was taken out on this home.
Original Mortgage
$250,000
Interest Rate
4.37%
Mortgage Type
Purchase Money Mortgage
Create a Home Valuation Report for This Property
The Home Valuation Report is an in-depth analysis detailing your home's value as well as a comparison with similar homes in the area
Home Values in the Area
Average Home Value in this Area
Purchase History
| Date | Buyer | Sale Price | Title Company |
|---|---|---|---|
| O'Neill Brian William | $565,000 | -- | |
| Min Byung Im | $236,485 | -- | |
| Min Byung Im | $339,690 | -- |
Source: Public Records
Mortgage History
| Date | Status | Borrower | Loan Amount |
|---|---|---|---|
| Open | O'Neill Brian William | $452,000 | |
| Previous Owner | Min Byung Im | $250,000 |
Source: Public Records
Tax History Compared to Growth
Tax History
| Year | Tax Paid | Tax Assessment Tax Assessment Total Assessment is a certain percentage of the fair market value that is determined by local assessors to be the total taxable value of land and additions on the property. | Land | Improvement |
|---|---|---|---|---|
| 2025 | $203 | $64,905 | $1,251 | $63,654 |
| 2024 | $203 | $63,930 | $1,251 | $62,679 |
| 2023 | $203 | $61,828 | $1,251 | $60,577 |
| 2022 | $198 | $52,745 | $1,251 | $51,494 |
| 2021 | $199 | $50,143 | $1,251 | $48,892 |
| 2020 | $6,365 | $55,522 | $1,251 | $54,271 |
| 2019 | $205 | $54,347 | $1,251 | $53,096 |
| 2018 | $207 | $46,071 | $1,251 | $44,820 |
| 2017 | $207 | $43,377 | $1,251 | $42,126 |
| 2016 | $209 | $43,377 | $1,251 | $42,126 |
| 2015 | $164 | $39,447 | $1,251 | $38,196 |
| 2014 | $164 | $36,442 | $1,545 | $34,897 |
Source: Public Records
Map
Nearby Homes
- 18-21 26th Ave
- 25-04 21st St
- 2504 21st St
- 26-19 14th Place
- 18-10 Astoria Blvd
- 25-35 Crescent St
- 2540 Shore Blvd Unit 4S
- 25-40 Shore Blvd Unit 17-K
- 25-40 Shore Blvd Unit 2
- 25-40 Shore Blvd Unit 4-S
- 25-40 Shore Blvd Unit 2F
- 25-25 Newtown Ave Unit 4D
- 27-23 Crescent St Unit 1-A
- 27-23 Crescent St Unit PHB
- 27-23 Crescent St Unit PH-A
- 27-23 Crescent St Unit 4-D
- 25-20 Newtown Ave Unit 2
- 906 27th Ave
- 27-04 Astoria Blvd Unit ENTIRE BUILDING
- 1446A 30th Ave Unit A
- 26-20 21st St Unit 2A
- 26-20 21st St Unit 6A
- 26-20 21st St Unit 4A
- 26-20 21st St Unit 401
- 26-20 21st St
- 26-20 21st St Unit 8B
- 26-20 21st St Unit 702
- 26-20 21st St Unit 9A
- 26-20 21st St Unit 5B
- 26-20 21st St Unit 2B
- 26-20 21st St Unit 3A
- 26-20 21st St Unit 3B
- 26-20 21st St Unit 1B
- 26-20 21st St Unit 8A
- 26-20 21st St Unit 602
- 26-20 21st St Unit 7-B
- 26-20 21st St Unit 101
- 26-18 21st St
- 1851 26th Rd
- 18-51 26th Rd