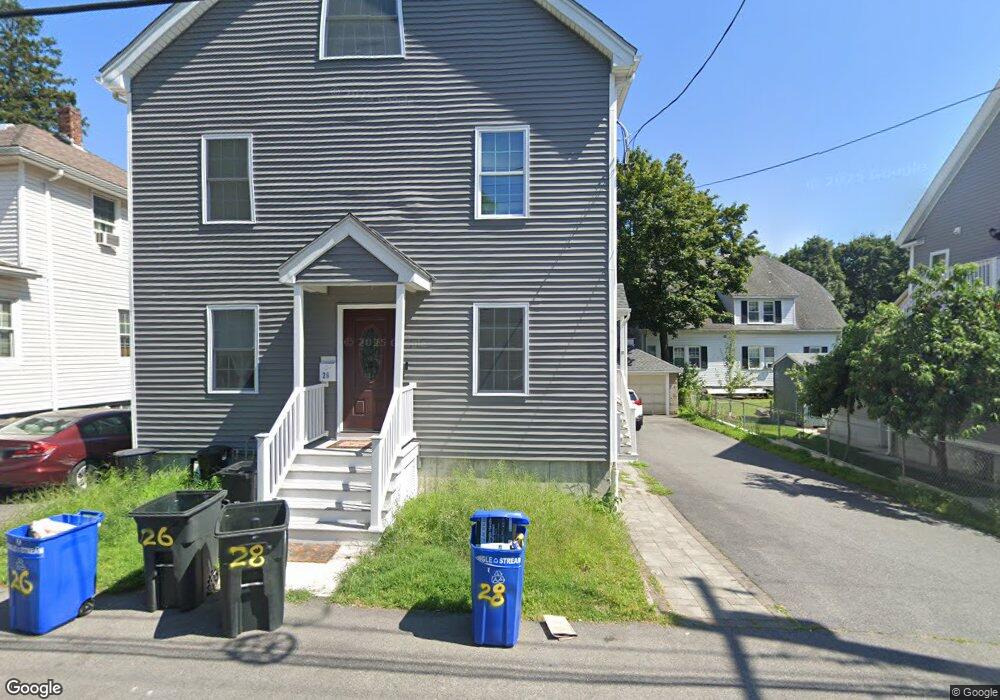
26-28 Station St Quincy, MA 02169
South Quincy NeighborhoodEstimated Value: $1,133,000 - $1,446,000
8
Beds
5
Baths
3,120
Sq Ft
$397/Sq Ft
Est. Value
About This Home
This home is located at 26-28 Station St, Quincy, MA 02169 and is currently estimated at $1,237,161, approximately $396 per square foot. 26-28 Station St is a home located in Norfolk County with nearby schools including South West Middle School, Lincoln-Hancock Community School, and Quincy High School.
Ownership History
Date
Name
Owned For
Owner Type
Purchase Details
Closed on
Dec 8, 2016
Sold by
An Jia Llc
Bought by
Chan Yit G and Su Fei K
Current Estimated Value
Purchase Details
Closed on
Jun 28, 2016
Sold by
Dicesare Joseph A and Dicesare Terri
Bought by
An Jia Llc
Purchase Details
Closed on
Dec 21, 1990
Sold by
Levin Admr Richard E
Bought by
Dicesare Joseph A
Home Financials for this Owner
Home Financials are based on the most recent Mortgage that was taken out on this home.
Original Mortgage
$102,600
Interest Rate
10.02%
Mortgage Type
Purchase Money Mortgage
Create a Home Valuation Report for This Property
The Home Valuation Report is an in-depth analysis detailing your home's value as well as a comparison with similar homes in the area
Home Values in the Area
Average Home Value in this Area
Purchase History
| Date | Buyer | Sale Price | Title Company |
|---|---|---|---|
| Chan Yit G | $265,000 | -- | |
| An Jia Llc | $236,900 | -- | |
| Dicesare Joseph A | $108,000 | -- |
Source: Public Records
Mortgage History
| Date | Status | Borrower | Loan Amount |
|---|---|---|---|
| Previous Owner | Dicesare Joseph A | $149,000 | |
| Previous Owner | Dicesare Joseph A | $98,400 | |
| Previous Owner | Dicesare Joseph A | $102,600 |
Source: Public Records
Tax History Compared to Growth
Tax History
| Year | Tax Paid | Tax Assessment Tax Assessment Total Assessment is a certain percentage of the fair market value that is determined by local assessors to be the total taxable value of land and additions on the property. | Land | Improvement |
|---|---|---|---|---|
| 2025 | $13,303 | $1,153,800 | $275,900 | $877,900 |
| 2024 | $12,560 | $1,114,500 | $262,800 | $851,700 |
| 2023 | $11,846 | $1,064,300 | $238,900 | $825,400 |
| 2022 | $11,998 | $1,001,500 | $199,000 | $802,500 |
| 2021 | $12,144 | $1,000,300 | $199,000 | $801,300 |
| 2020 | $13,249 | $1,065,900 | $199,000 | $866,900 |
| 2019 | $10,107 | $805,300 | $187,800 | $617,500 |
| 2018 | $4,073 | $305,300 | $173,900 | $131,400 |
| 2017 | $4,308 | $304,000 | $165,600 | $138,400 |
| 2016 | $3,942 | $274,500 | $144,000 | $130,500 |
| 2015 | $3,821 | $261,700 | $144,000 | $117,700 |
| 2014 | $3,685 | $248,000 | $144,000 | $104,000 |
Source: Public Records
Map
Nearby Homes
- 57 Buckley St
- 46-48 Buckley St
- 14 Arthur Ave
- 21 Arthur St
- 211 Copeland St
- 91 Garfield St
- 46 Suomi Rd
- 46 Suomi Rd Unit 46
- 211 West St Unit 12B
- 510 Willard St
- 64 Garfield St Unit B
- 21 Totman St Unit 202
- 21 Totman St Unit 309
- 21 Totman St Unit Model-1
- 21 Totman St Unit 209
- 21 Totman St Unit 203
- 21 Totman St Unit 2
- 94 Brook Rd Unit 3
- 118 Brook Rd Unit 2
- 52 Bunker Hill Ln
- 26 Station St
- 26 Station St Unit 1
- 28 Station St Unit 2
- 22 Station St
- 32 Station St
- 12 McDonald St Unit 12
- 10 McDonald St
- 10-14 McDonald St
- 14 McDonald St
- 20 Station St
- 24 McDonald St
- 28 McDonald St
- 16 Station St
- 31 Station St
- 31 Station St Unit 31
- 25 Station St
- 40 Station St
- 40 Station St Unit 1
- 32 McDonald St
- 9 McDonald St