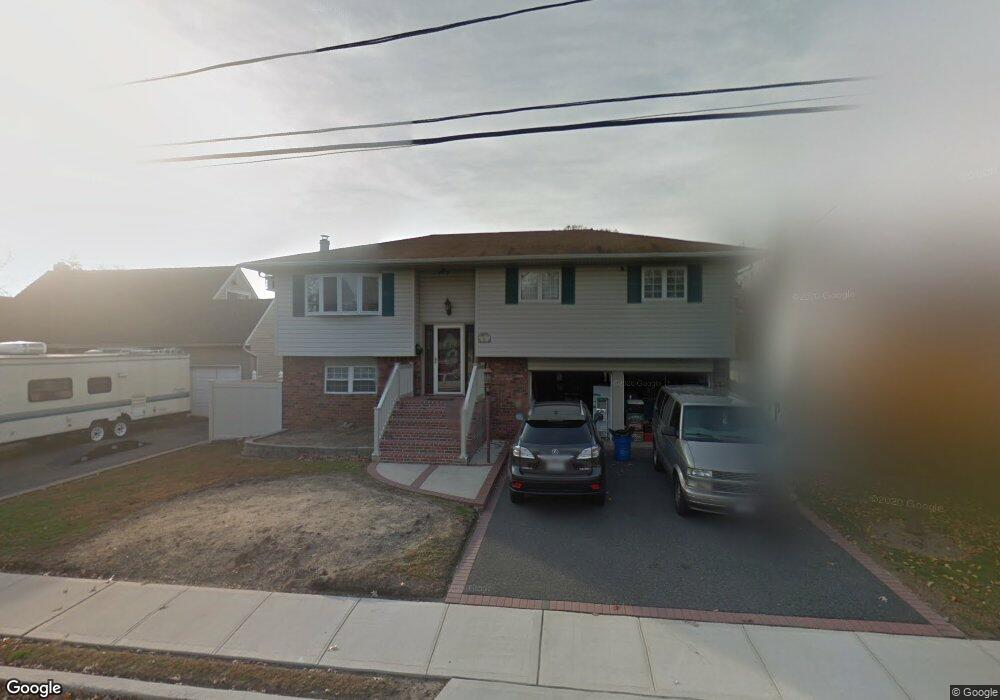
26 2nd Ave Massapequa Park, NY 11762
Estimated Value: $813,599 - $833,000
3
Beds
2
Baths
6,000
Sq Ft
$137/Sq Ft
Est. Value
About This Home
This home is located at 26 2nd Ave, Massapequa Park, NY 11762 and is currently estimated at $823,300, approximately $137 per square foot. 26 2nd Ave is a home located in Nassau County with nearby schools including Massapequa High School - Ames Campus, Berner Middle School, and Massapequa High School.
Ownership History
Date
Name
Owned For
Owner Type
Purchase Details
Closed on
Aug 25, 2014
Sold by
Lange Dayna L and Lange Erik
Bought by
Iovino Jennifer
Current Estimated Value
Purchase Details
Closed on
Nov 17, 2008
Sold by
Ficarella Andrew J and Ficarella Patricia
Bought by
Lange Erik and Lange Dayna L
Create a Home Valuation Report for This Property
The Home Valuation Report is an in-depth analysis detailing your home's value as well as a comparison with similar homes in the area
Home Values in the Area
Average Home Value in this Area
Purchase History
| Date | Buyer | Sale Price | Title Company |
|---|---|---|---|
| Iovino Jennifer | $520,000 | Custom Title Services Inc | |
| Iovino Jennifer | $520,000 | Custom Title Services Inc | |
| Lange Erik | $480,000 | Alpha Abstract Llc | |
| Lange Erik | $480,000 | Alpha Abstract Llc |
Source: Public Records
Mortgage History
| Date | Status | Borrower | Loan Amount |
|---|---|---|---|
| Closed | Iovino Jennifer | $0 |
Source: Public Records
Tax History Compared to Growth
Tax History
| Year | Tax Paid | Tax Assessment Tax Assessment Total Assessment is a certain percentage of the fair market value that is determined by local assessors to be the total taxable value of land and additions on the property. | Land | Improvement |
|---|---|---|---|---|
| 2025 | $12,347 | $461 | $172 | $289 |
| 2024 | $3,129 | $454 | $170 | $284 |
| 2023 | $12,307 | $482 | $180 | $302 |
| 2022 | $12,307 | $484 | $181 | $303 |
| 2021 | $12,201 | $490 | $183 | $307 |
| 2020 | $12,832 | $788 | $605 | $183 |
| 2019 | $13,043 | $788 | $568 | $220 |
| 2018 | $10,793 | $840 | $0 | $0 |
| 2017 | $7,450 | $893 | $574 | $319 |
| 2016 | $10,862 | $945 | $607 | $338 |
| 2015 | -- | $1,046 | $672 | $374 |
| 2014 | -- | $1,046 | $672 | $374 |
| 2013 | $3,304 | $1,046 | $672 | $374 |
Source: Public Records
Map
Nearby Homes