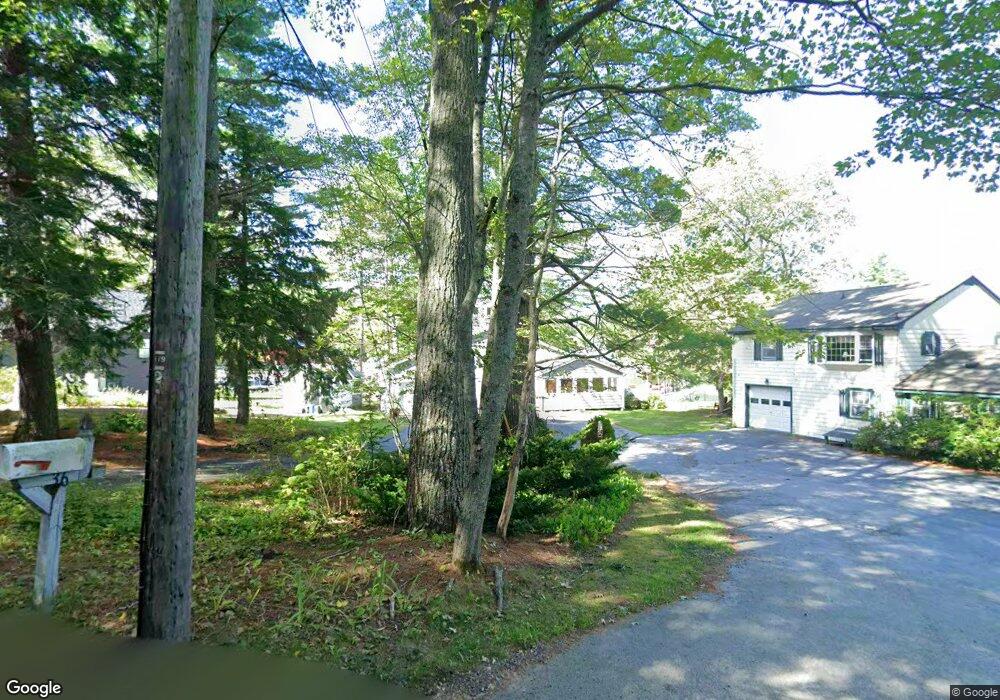
26 2nd St Winchendon, MA 01475
Estimated Value: $495,000 - $567,000
4
Beds
2
Baths
1,856
Sq Ft
$287/Sq Ft
Est. Value
About This Home
This home is located at 26 2nd St, Winchendon, MA 01475 and is currently estimated at $531,745, approximately $286 per square foot. 26 2nd St is a home located in Worcester County with nearby schools including Memorial and Toy Town Elementary School.
Ownership History
Date
Name
Owned For
Owner Type
Purchase Details
Closed on
Jan 7, 2013
Sold by
Charles Robert T
Bought by
Charles Robert T and Charles Joy
Current Estimated Value
Home Financials for this Owner
Home Financials are based on the most recent Mortgage that was taken out on this home.
Original Mortgage
$230,000
Outstanding Balance
$42,266
Interest Rate
3.35%
Mortgage Type
New Conventional
Estimated Equity
$489,479
Purchase Details
Closed on
Jun 5, 2007
Sold by
White-Charters Jenny R and Charters Robert T
Bought by
Charters Robert T
Purchase Details
Closed on
Dec 1, 1999
Sold by
Martin Charles D and Green Wayne
Bought by
Charters Robert T and White-Charters Jenny R
Create a Home Valuation Report for This Property
The Home Valuation Report is an in-depth analysis detailing your home's value as well as a comparison with similar homes in the area
Home Values in the Area
Average Home Value in this Area
Purchase History
| Date | Buyer | Sale Price | Title Company |
|---|---|---|---|
| Charles Robert T | -- | -- | |
| Charles Robert T | -- | -- | |
| Charters Robert T | -- | -- | |
| Charters Robert T | -- | -- | |
| Charters Robert T | -- | -- | |
| Charters Robert T | $180,000 | -- | |
| Charters Robert T | $180,000 | -- |
Source: Public Records
Mortgage History
| Date | Status | Borrower | Loan Amount |
|---|---|---|---|
| Open | Charters Robert T | $230,000 | |
| Closed | Charters Robert T | $230,000 |
Source: Public Records
Tax History
| Year | Tax Paid | Tax Assessment Tax Assessment Total Assessment is a certain percentage of the fair market value that is determined by local assessors to be the total taxable value of land and additions on the property. | Land | Improvement |
|---|---|---|---|---|
| 2025 | $5,433 | $462,400 | $222,100 | $240,300 |
| 2024 | $5,493 | $438,000 | $213,900 | $224,100 |
| 2023 | $5,491 | $409,800 | $203,200 | $206,600 |
| 2022 | $5,825 | $385,500 | $203,200 | $182,300 |
| 2021 | $5,373 | $341,800 | $184,700 | $157,100 |
| 2020 | $5,213 | $320,200 | $175,800 | $144,400 |
| 2019 | $4,961 | $296,900 | $160,400 | $136,500 |
| 2018 | $4,728 | $272,500 | $142,600 | $129,900 |
| 2017 | $4,890 | $272,100 | $148,500 | $123,600 |
| 2016 | $4,420 | $253,600 | $134,700 | $118,900 |
| 2015 | $4,190 | $250,600 | $134,700 | $115,900 |
| 2014 | $4,284 | $268,400 | $157,000 | $111,400 |
Source: Public Records
Map
Nearby Homes
- 35 Hillside Dr
- 226 Lakeview Dr
- 19 Monomonac Terrace
- 0 Monomonac Rd W
- 78 Colburn Ln
- 226 Glenallen St
- 150-152 Mill Cir
- 518 Main St
- 16 Maple Place
- 668 Forristall Rd
- 11 Colonial Ln
- 119 W Shore Dr
- 98 Goldmine Rd
- Lot 1 Saybrook Dr
- Lot 2 Saybrook Dr
- Lot 14 Saybrook Dr
- 20 Harvard St
- 29 Winter St
- 33 East St
- 116 Maple St
Your Personal Tour Guide
Ask me questions while you tour the home.