Estimated Value: $132,000 - $194,000
3
Beds
2
Baths
1,966
Sq Ft
$84/Sq Ft
Est. Value
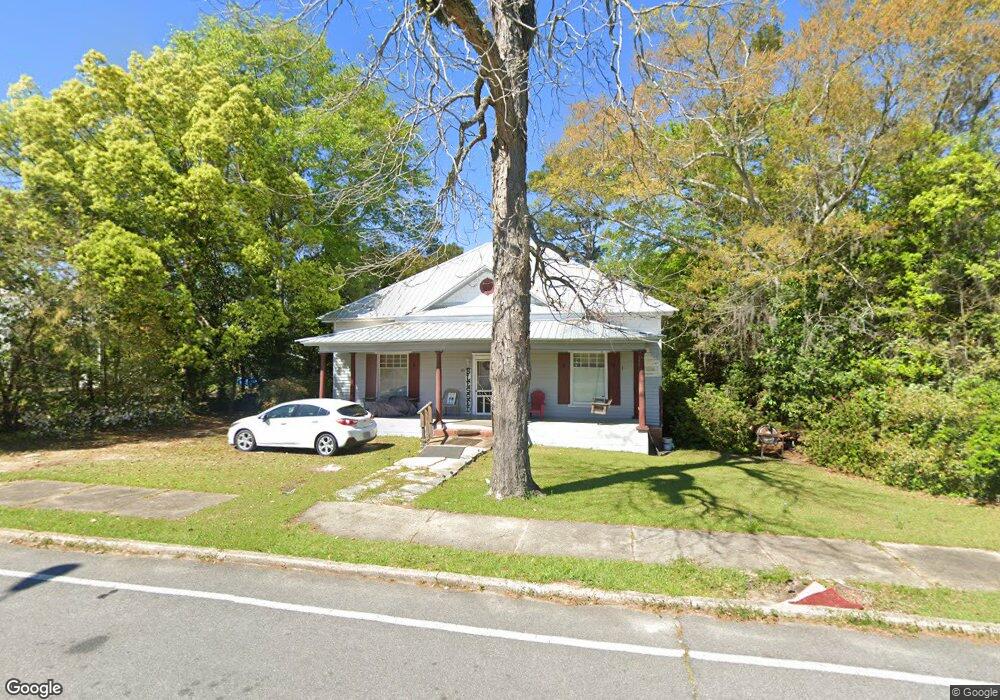
About This Home
This home is located at 26 3rd Ave SW, Cairo, GA 39828 and is currently estimated at $164,270, approximately $83 per square foot. 26 3rd Ave SW is a home located in Grady County with nearby schools including Cairo High School.
Ownership History
Date
Name
Owned For
Owner Type
Purchase Details
Closed on
Jan 5, 2022
Sold by
Ponder Rentals Llc
Bought by
Market Rate Rentals Ga Ii Llc and Market Rate Rentals Llc
Current Estimated Value
Purchase Details
Closed on
Oct 17, 2014
Sold by
Ponder Farms Inc
Bought by
Ponder Rentals Llc
Purchase Details
Closed on
Apr 11, 2014
Sold by
Vanlandingham Joyce
Bought by
Ponder Farms Inc
Purchase Details
Closed on
Jul 31, 2013
Sold by
Vanlandingham Joyce
Bought by
Vanlandingham Joyce
Purchase Details
Closed on
Jul 29, 2013
Sold by
Vanlandingham William J
Bought by
Vanlandingham Joyce
Purchase Details
Closed on
Feb 28, 1997
Bought by
Vanlandingham W J
Purchase Details
Closed on
Apr 15, 1977
Bought by
Vanlandingham W J
Create a Home Valuation Report for This Property
The Home Valuation Report is an in-depth analysis detailing your home's value as well as a comparison with similar homes in the area
Purchase History
| Date | Buyer | Sale Price | Title Company |
|---|---|---|---|
| Market Rate Rentals Ga Ii Llc | $575,000 | -- | |
| Ponder Rentals Llc | -- | -- | |
| Ponder Farms Inc | $115,000 | -- | |
| Vanlandingham Joyce | -- | -- | |
| Vanlandingham Joyce | -- | -- | |
| Vanlandingham W J | -- | -- | |
| Vanlandingham W J | -- | -- |
Source: Public Records
Tax History
| Year | Tax Paid | Tax Assessment Tax Assessment Total Assessment is a certain percentage of the fair market value that is determined by local assessors to be the total taxable value of land and additions on the property. | Land | Improvement |
|---|---|---|---|---|
| 2024 | $1,657 | $48,946 | $2,070 | $46,876 |
| 2023 | $732 | $19,785 | $2,775 | $17,010 |
| 2022 | $762 | $19,785 | $2,775 | $17,010 |
| 2021 | $764 | $19,785 | $2,775 | $17,010 |
| 2020 | $766 | $19,785 | $2,775 | $17,010 |
| 2019 | $766 | $19,785 | $2,775 | $17,010 |
| 2018 | $728 | $25,455 | $2,775 | $22,680 |
| 2017 | $901 | $25,455 | $2,775 | $22,680 |
| 2016 | $764 | $21,111 | $2,775 | $18,336 |
| 2015 | $756 | $21,111 | $2,775 | $18,336 |
| 2014 | -- | $21,111 | $2,775 | $18,336 |
| 2013 | -- | $19,064 | $2,774 | $16,290 |
Source: Public Records
Map
Nearby Homes
- 00 Hwy 111 South Tract 1
- X 1st St
- 0 1st St
- 309 3rd St SE
- 460 2nd St SW
- 4761 Hadley Ferry Rd
- 580 5th St SE
- 00 Blackberry Ln
- 00 Meridian Rd
- 125 6th Ave NW
- 112 Pine Cir SW
- 320 8th St SW
- 00 00 Hwy 111 South Tract 2
- 530 6th Ave SE
- 117 SW Pine Cirlce
- 0 Georgia 111
- 711 2nd Ave NE
- 1193 S Broad St
- 220 8th Ave NW
- 2975 U S 84
- 22 3rd Ave SW
- 32 3rd Ave SW
- 14 3rd Ave SW
- 40 3rd Ave SW
- 33 3rd Ave SW
- 318 S Broad St
- 41 3rd Ave SW
- 100 3rd Ave SW
- 21 Martin Luther King Junior Ave Unit 11
- 21 Martin Luther King Junior Ave Unit 21
- 21 Martin Luther King Junior Ave Unit 15
- 21 Martin Luther King Junior Ave
- 21 Martin Luther King Junior Ave Unit 17
- 21 Martin Luther King jr Ave SW Unit 17
- 21 Martin Luther King jr Ave SW
- 319 1st St SW
- 107 3rd Ave SW
- 110 3rd Ave SW
- 34 4th Ave SW
- 40 4th Ave SW
Your Personal Tour Guide
Ask me questions while you tour the home.