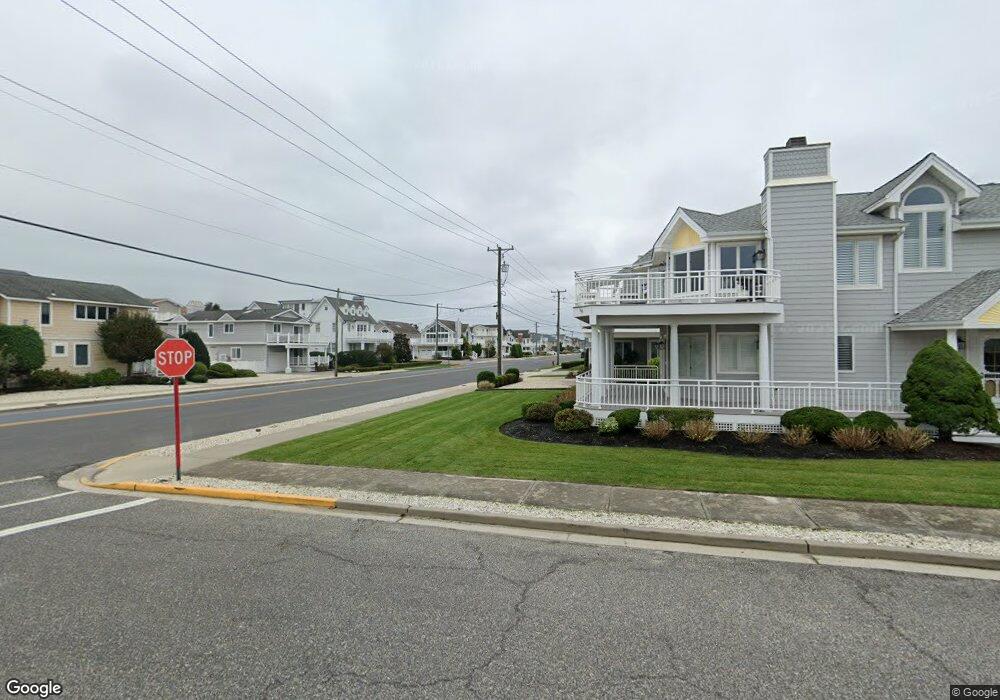
26 9th St W Avalon, NJ 08202
Estimated Value: $2,657,000 - $3,300,000
Studio
--
Bath
2,152
Sq Ft
$1,331/Sq Ft
Est. Value
About This Home
This home is located at 26 9th St W, Avalon, NJ 08202 and is currently estimated at $2,865,355, approximately $1,331 per square foot. 26 9th St W is a home located in Cape May County with nearby schools including Avalon Elementary School.
Ownership History
Date
Name
Owned For
Owner Type
Purchase Details
Closed on
Mar 9, 2016
Sold by
Flannery Mary K and Flannery Katherine A
Bought by
Nickel Rocket Llc
Current Estimated Value
Purchase Details
Closed on
Dec 17, 2015
Sold by
Flannery Mary K
Bought by
Flannery Mary K and Flannery Katherine A
Purchase Details
Closed on
Nov 3, 2008
Sold by
Flannery Mary K
Bought by
Flannery Mary K and Tuw Of John F Flannery
Purchase Details
Closed on
Sep 15, 2006
Sold by
Flannery Rosemary M and Flannery John F
Bought by
Flannery John F and Flannery Rosemary M
Create a Home Valuation Report for This Property
The Home Valuation Report is an in-depth analysis detailing your home's value as well as a comparison with similar homes in the area
Home Values in the Area
Average Home Value in this Area
Purchase History
| Date | Buyer | Sale Price | Title Company |
|---|---|---|---|
| Nickel Rocket Llc | -- | Attorney | |
| Flannery Mary K | -- | None Available | |
| Flannery Mary K | -- | None Available | |
| Flannery John F | -- | None Available |
Source: Public Records
Tax History
| Year | Tax Paid | Tax Assessment Tax Assessment Total Assessment is a certain percentage of the fair market value that is determined by local assessors to be the total taxable value of land and additions on the property. | Land | Improvement |
|---|---|---|---|---|
| 2025 | $8,215 | $1,337,900 | $1,200,000 | $137,900 |
| 2024 | $8,215 | $1,337,900 | $1,200,000 | $137,900 |
| 2023 | $8,148 | $1,337,900 | $1,200,000 | $137,900 |
| 2022 | $7,599 | $1,337,900 | $1,200,000 | $137,900 |
| 2021 | $7,318 | $1,337,900 | $1,200,000 | $137,900 |
| 2020 | $7,037 | $1,337,900 | $1,200,000 | $137,900 |
| 2019 | $6,823 | $1,337,900 | $1,200,000 | $137,900 |
| 2018 | $6,529 | $1,337,900 | $1,200,000 | $137,900 |
| 2017 | $5,976 | $1,074,800 | $900,000 | $174,800 |
| 2016 | $5,911 | $1,074,800 | $900,000 | $174,800 |
| 2015 | $5,815 | $1,074,800 | $900,000 | $174,800 |
| 2014 | $5,750 | $1,074,800 | $900,000 | $174,800 |
Source: Public Records
Map
Nearby Homes
Your Personal Tour Guide
Ask me questions while you tour the home.