26 Abbot Bridge Dr Andover, MA 01810
Southern Andover NeighborhoodEstimated Value: $1,037,909 - $1,347,000
About This Home
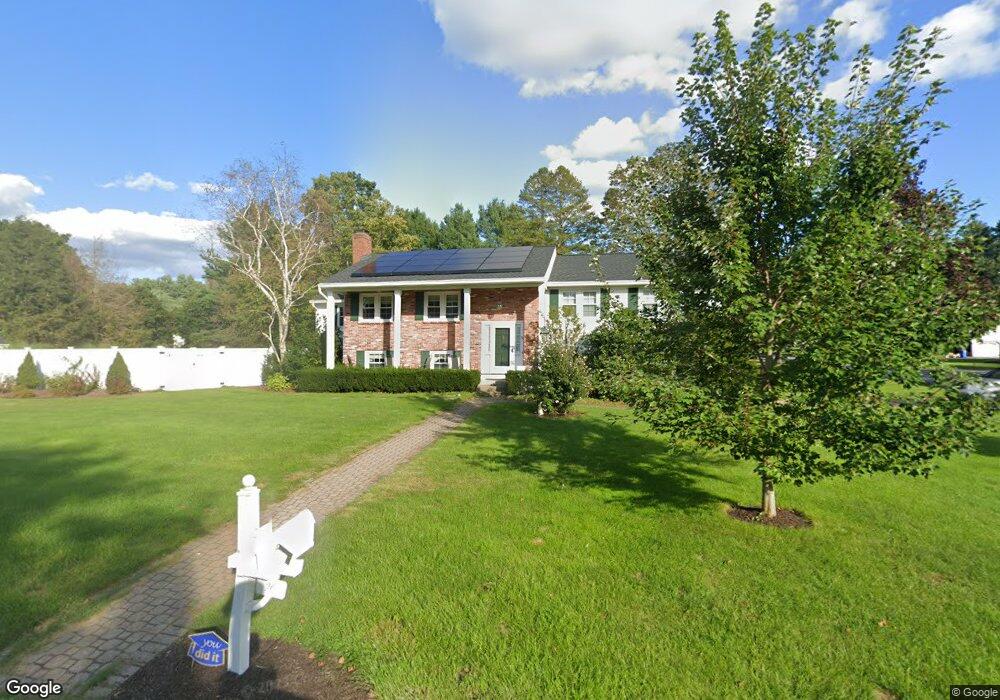
This home is located at 26 Abbot Bridge Dr, Andover, MA 01810 and is currently estimated at $1,155,977, approximately $480 per square foot. 26 Abbot Bridge Dr is a home located in Essex County with nearby schools including South Elementary School, Doherty Middle School, and Andover High School.
Ownership History
We collect this data history from publicly available records. To have your information removed, we recommend requesting removal directly through your county’s website.
Purchase Details
Home Values in the Area
Average Home Value in this Area
Purchase History
We collect this data history from publicly available records. To have your information removed, we recommend requesting removal directly through your county’s website.
| Date | Buyer | Sale Price | Title Company |
|---|---|---|---|
| $560,000 | -- | ||
| $560,000 | -- | ||
| $560,000 | -- |
Mortgage History
We collect this data history from publicly available records. To have your information removed, we recommend requesting removal directly through your county’s website.
| Date | Status | Borrower | Loan Amount |
|---|---|---|---|
| Open | $250,000 | ||
| Closed | $224,000 | ||
| Closed | $210,000 |
Tax History
We collect this data history from publicly available records. To have your information removed, we recommend requesting removal directly through your county’s website.
| Year | Tax Paid | Tax Assessment Tax Assessment Total Assessment is a certain percentage of the fair market value that is determined by local assessors to be the total taxable value of land and additions on the property. | Land | Improvement |
|---|---|---|---|---|
| 2025 | $10,826 | $866,800 | $527,000 | $339,800 |
| 2024 | $10,596 | $822,700 | $507,500 | $315,200 |
| 2023 | $10,275 | $752,200 | $457,000 | $295,200 |
| 2022 | $9,310 | $637,700 | $397,500 | $240,200 |
| 2021 | $8,931 | $584,100 | $361,400 | $222,700 |
| 2020 | $8,592 | $572,400 | $352,700 | $219,700 |
| 2019 | $8,211 | $537,700 | $322,200 | $215,500 |
| 2018 | $7,970 | $509,600 | $309,800 | $199,800 |
| 2017 | $7,643 | $503,500 | $303,800 | $199,700 |
| 2016 | $7,486 | $505,100 | $303,800 | $201,300 |
| 2015 | $7,236 | $483,400 | $292,100 | $191,300 |
Map
- 111 Abbot St
- 1 Delisio Dr
- 49 Abbot St
- 75 Spring Grove Rd
- 48 Reservation Rd
- 22 Alden Rd
- 275 S Main St
- 232 Andover St
- 19 Tilton Ln
- 75 Essex St
- 33 Chestnut St Unit 2
- 11 Cuba St
- 56 Sunset Rock Rd
- 139 Hidden Rd
- 49 Salem St
- 28 Algonquin Ave
- 7 Cider Hill Way
- 2 Brechin Terrace
- 60 Morton St Unit R
- 10 Hemlock Rd
- 4 Hartford Cir
- 24 Abbot Bridge Dr
- 25 Abbot Bridge Dr
- 6 Hartford Cir
- 3 Jefferson Ln
- 23 Abbot Bridge Dr
- 30 Abbot Bridge Dr
- 27 Abbot Bridge Dr
- 3 Hartford Cir
- 5 Jefferson Ln
- 5 Hartford Cir
- 8 Hartford Cir
- 21 Abbot Bridge Dr
- 7 Jefferson Ln
- 29 Abbot Bridge Dr
- 7 Hartford Cir
- 10 Hartford Cir
- 9 Jefferson Ln
- 9 Hartford Cir
- 20 Abbot Bridge Dr
Ask me questions while you tour the home.