Estimated Value: $794,000 - $1,413,000
3
Beds
4
Baths
2,267
Sq Ft
$471/Sq Ft
Est. Value
About This Home
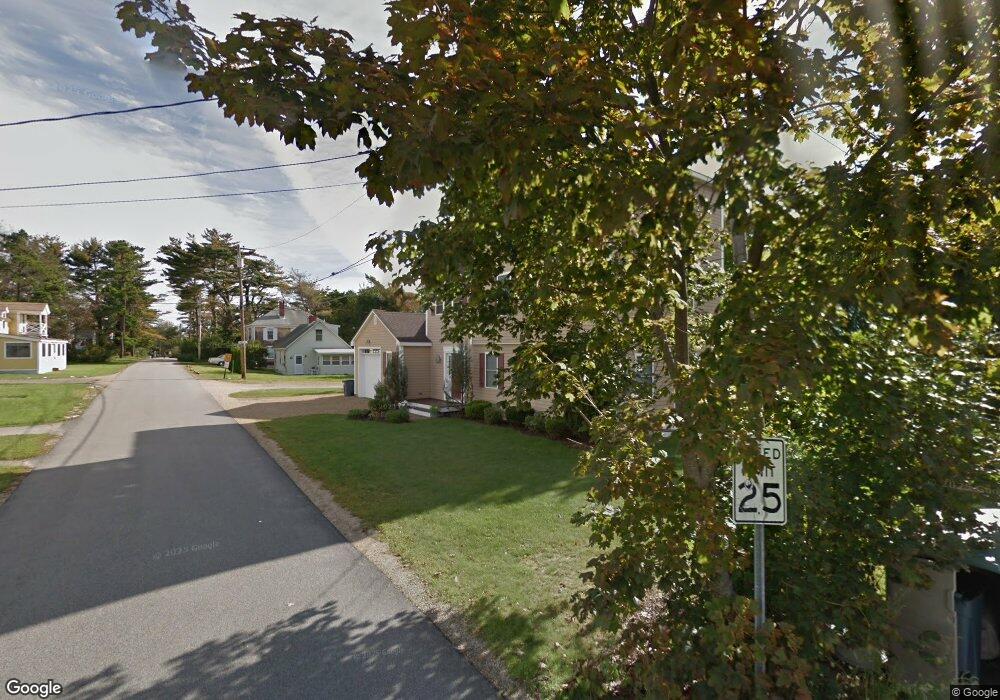
This home is located at 26 Acorn St, York, ME 03909 and is currently estimated at $1,068,282, approximately $471 per square foot. 26 Acorn St is a home located in York County with nearby schools including Coastal Ridge Elementary School, Village Elementary School, and York Middle School.
Ownership History
Date
Name
Owned For
Owner Type
Purchase Details
Closed on
Feb 22, 2006
Sold by
Foss William H
Bought by
26 Acorn Street T and 26 Foss
Current Estimated Value
Purchase Details
Closed on
Aug 1, 2005
Sold by
Eastman Inc
Bought by
Foss William H
Home Financials for this Owner
Home Financials are based on the most recent Mortgage that was taken out on this home.
Original Mortgage
$500,000
Interest Rate
6%
Mortgage Type
Adjustable Rate Mortgage/ARM
Create a Home Valuation Report for This Property
The Home Valuation Report is an in-depth analysis detailing your home's value as well as a comparison with similar homes in the area
Home Values in the Area
Average Home Value in this Area
Purchase History
| Date | Buyer | Sale Price | Title Company |
|---|---|---|---|
| 26 Acorn Street T | -- | -- | |
| Foss William H | -- | -- | |
| Foss William H | -- | -- | |
| Foss William H | -- | -- |
Source: Public Records
Mortgage History
| Date | Status | Borrower | Loan Amount |
|---|---|---|---|
| Open | Foss William H | $417,000 | |
| Previous Owner | Foss William H | $500,000 |
Source: Public Records
Tax History Compared to Growth
Tax History
| Year | Tax Paid | Tax Assessment Tax Assessment Total Assessment is a certain percentage of the fair market value that is determined by local assessors to be the total taxable value of land and additions on the property. | Land | Improvement |
|---|---|---|---|---|
| 2024 | $6,469 | $770,100 | $313,400 | $456,700 |
| 2023 | $6,507 | $770,100 | $313,400 | $456,700 |
| 2022 | $6,584 | $770,100 | $313,400 | $456,700 |
| 2021 | $6,841 | $687,500 | $292,500 | $395,000 |
| 2020 | $3,258 | $590,000 | $275,800 | $314,200 |
| 2019 | $3,538 | $583,900 | $275,800 | $308,100 |
| 2018 | $6,136 | $550,300 | $275,800 | $274,500 |
| 2017 | $5,818 | $531,300 | $267,400 | $263,900 |
| 2016 | $6,091 | $546,300 | $267,400 | $278,900 |
| 2015 | $5,887 | $535,200 | $267,400 | $267,800 |
| 2014 | $5,727 | $535,200 | $267,400 | $267,800 |
| 2013 | $5,582 | $535,200 | $267,400 | $267,800 |
Source: Public Records
Map
Nearby Homes
- 10 Amherst Ave Unit 10
- 10 Amherst Ave
- 3 Cornish Ave
- 10 Yorke Ridge Way
- 8 Surfore Rd
- 4 Surfore Dr
- 277 Long Beach Ave
- 6 Dingle Rd Unit 4
- 6 Dingle Rd Unit 5
- 23 Kerry Rd
- 384 Ridge Rd
- 35 Gunnison Rd
- 15 Summer Breeze Unit A & B
- 361 Long Beach Ave
- 81 Nubble Rd
- 1 Ocean Ave Unit 306/308 Fraction 5
- 1 Ocean Ave Unit 306/308 Fraction 4
- 1 Ocean Ave Unit 406/408 Fraction 4
- 1 Ocean Ave Unit 210/212 Fraction 3
- 1 Ocean Ave Unit 402/404 Fraction 1