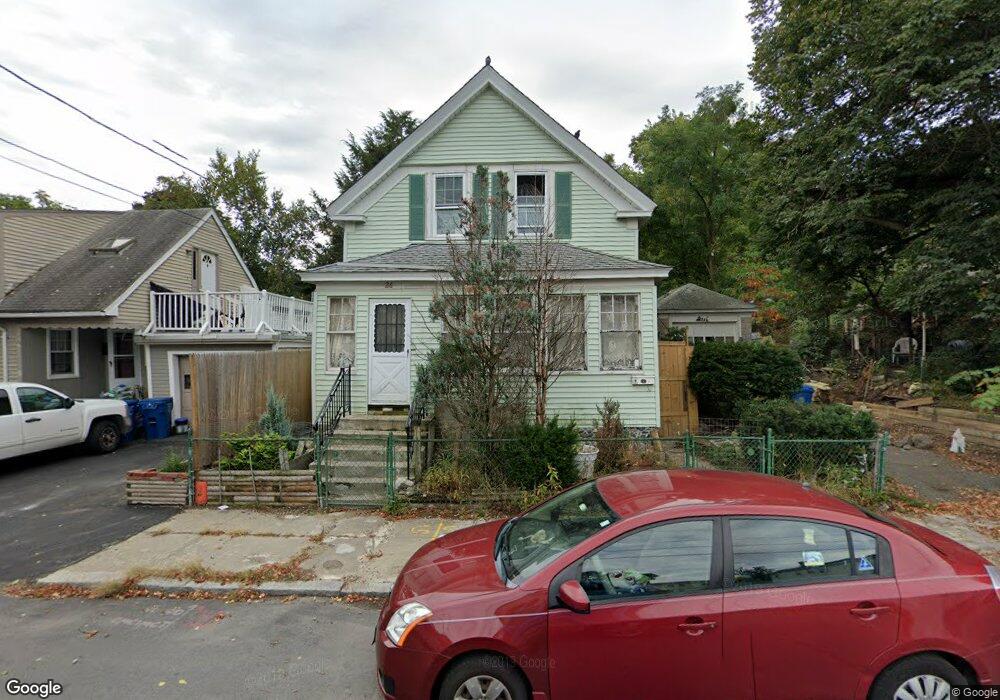
26 Allston St Lawrence, MA 01841
Prospect Hill-Back Bay NeighborhoodEstimated Value: $443,000 - $506,000
3
Beds
1
Bath
1,288
Sq Ft
$379/Sq Ft
Est. Value
About This Home
This home is located at 26 Allston St, Lawrence, MA 01841 and is currently estimated at $487,775, approximately $378 per square foot. 26 Allston St is a home located in Essex County with nearby schools including James F. Hennessey School, School For Exceptional Studies, and Community Day Charter Public School - Gateway.
Ownership History
Date
Name
Owned For
Owner Type
Purchase Details
Closed on
Aug 31, 1993
Sold by
Bean Donald B
Bought by
Barnes Kenneth H
Current Estimated Value
Home Financials for this Owner
Home Financials are based on the most recent Mortgage that was taken out on this home.
Original Mortgage
$65,700
Interest Rate
7.06%
Mortgage Type
Purchase Money Mortgage
Create a Home Valuation Report for This Property
The Home Valuation Report is an in-depth analysis detailing your home's value as well as a comparison with similar homes in the area
Home Values in the Area
Average Home Value in this Area
Purchase History
| Date | Buyer | Sale Price | Title Company |
|---|---|---|---|
| Barnes Kenneth H | $73,000 | -- |
Source: Public Records
Mortgage History
| Date | Status | Borrower | Loan Amount |
|---|---|---|---|
| Closed | Barnes Kenneth H | $65,700 | |
| Previous Owner | Barnes Kenneth H | $20,000 |
Source: Public Records
Tax History Compared to Growth
Tax History
| Year | Tax Paid | Tax Assessment Tax Assessment Total Assessment is a certain percentage of the fair market value that is determined by local assessors to be the total taxable value of land and additions on the property. | Land | Improvement |
|---|---|---|---|---|
| 2025 | $3,668 | $416,800 | $160,200 | $256,600 |
| 2024 | $3,509 | $379,400 | $153,600 | $225,800 |
| 2023 | $3,409 | $335,500 | $132,800 | $202,700 |
| 2022 | $3,244 | $283,600 | $123,400 | $160,200 |
| 2021 | $3,187 | $259,700 | $123,400 | $136,300 |
| 2020 | $2,931 | $235,800 | $99,500 | $136,300 |
| 2019 | $3,074 | $224,700 | $101,600 | $123,100 |
| 2018 | $2,920 | $203,900 | $92,600 | $111,300 |
| 2017 | $2,792 | $182,000 | $91,200 | $90,800 |
| 2016 | $2,371 | $152,900 | $61,200 | $91,700 |
| 2015 | $2,312 | $152,900 | $61,200 | $91,700 |
Source: Public Records
Map
Nearby Homes
- 52 Howard St
- 19-21 Pleasant Terrace
- 80 Ferry St Unit 80A
- 7 Stevens Ct
- 262 E Haverhill St Unit 4
- 6 Brook St
- 106 Leroy Ave
- 42 Union St
- 68 Wesley St
- 65 Brook St
- 167 Ferry 53 Mann St Unit 2,5,6
- 32 Orchard St
- 4 Shawsheen Rd Unit 2
- 89 Newbury St Unit 89B
- 192 Union St
- 35 Kendall St
- 100-102 E Haverhill St
- 1 Riverview Blvd Unit 3-8
- 1 Riverview Blvd Unit 2-203
- 80 Market St
- 34 Allston St
- 24 Allston St
- 38 Allston St
- 38 Allston St Unit 2
- 112 Marston St Unit 20D
- 112 Marston St Unit 418
- 112 Marston St Unit 410
- 112 Marston St Unit 406
- 112 Marston St Unit 320
- 112 Marston St Unit 109
- 112 Marston St Unit 317
- 112 Marston St Unit 215
- 112 Marston St Unit 304
- 112 Marston St Unit 208
- 112 Marston St Unit 113
- 112 Marston St Unit 120
- 112-114 Marston St
- 112-114 Marston St
- 20 Allston St
- 20 Allston St Unit 20D