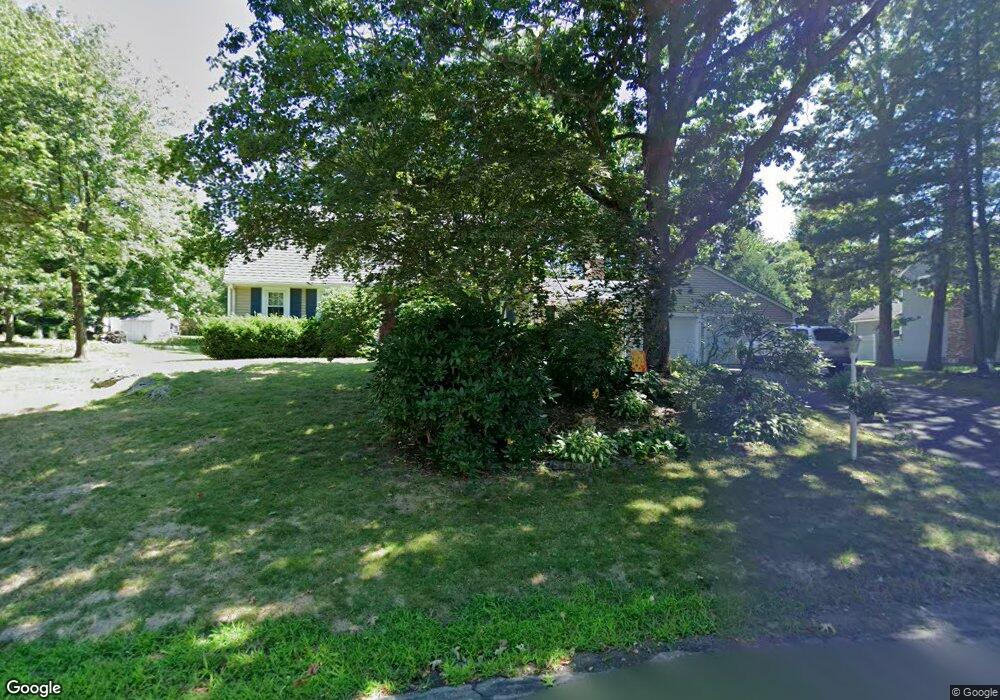
26 Alton Rd North Attleboro, MA 02760
North Attleboro NeighborhoodEstimated Value: $589,000 - $712,000
4
Beds
3
Baths
2,032
Sq Ft
$323/Sq Ft
Est. Value
About This Home
This home is located at 26 Alton Rd, North Attleboro, MA 02760 and is currently estimated at $656,374, approximately $323 per square foot. 26 Alton Rd is a home located in Bristol County with nearby schools including North Attleboro High School and Cadence Academy Preschool - North Attleborough.
Ownership History
Date
Name
Owned For
Owner Type
Purchase Details
Closed on
Sep 11, 1987
Sold by
Shillinglaw David A
Bought by
Petrella Domenico
Current Estimated Value
Home Financials for this Owner
Home Financials are based on the most recent Mortgage that was taken out on this home.
Original Mortgage
$55,000
Interest Rate
10.27%
Mortgage Type
Purchase Money Mortgage
Create a Home Valuation Report for This Property
The Home Valuation Report is an in-depth analysis detailing your home's value as well as a comparison with similar homes in the area
Home Values in the Area
Average Home Value in this Area
Purchase History
| Date | Buyer | Sale Price | Title Company |
|---|---|---|---|
| Petrella Domenico | $197,000 | -- |
Source: Public Records
Mortgage History
| Date | Status | Borrower | Loan Amount |
|---|---|---|---|
| Closed | Petrella Domenico | $54,000 | |
| Closed | Petrella Domenico | $55,000 |
Source: Public Records
Tax History Compared to Growth
Tax History
| Year | Tax Paid | Tax Assessment Tax Assessment Total Assessment is a certain percentage of the fair market value that is determined by local assessors to be the total taxable value of land and additions on the property. | Land | Improvement |
|---|---|---|---|---|
| 2025 | $6,165 | $522,900 | $148,600 | $374,300 |
| 2024 | $6,137 | $531,800 | $148,600 | $383,200 |
| 2023 | $5,876 | $459,400 | $148,600 | $310,800 |
| 2022 | $5,594 | $401,600 | $148,600 | $253,000 |
| 2021 | $5,464 | $382,900 | $148,600 | $234,300 |
| 2020 | $5,397 | $376,100 | $148,600 | $227,500 |
| 2019 | $4,936 | $346,600 | $135,100 | $211,500 |
| 2018 | $4,457 | $334,100 | $135,100 | $199,000 |
| 2017 | $4,417 | $334,100 | $135,100 | $199,000 |
| 2016 | $4,340 | $328,300 | $150,100 | $178,200 |
| 2015 | $4,175 | $317,700 | $150,100 | $167,600 |
| 2014 | $3,964 | $299,400 | $131,800 | $167,600 |
Source: Public Records
Map
Nearby Homes
- 34 Hawthorne St
- 64 Smith St
- 35-R Whiting St
- 835 Mt Hope St Unit 39
- 2 Franklin Ave
- 271 N Washington St
- 194 Smith St
- 157 Fisher St
- 45 Moran St
- 39 Columbia St
- 12 Houde St
- 633 E Washington St Unit 17
- 0 Landry 2nd Unit 73350867
- Lot 5 Jeffrey Dr
- Lot 2 Jeffrey Dr
- 105 East St
- 711 Mount Hope St Unit 13
- 711 Mount Hope St Unit 8
- 711 Mount Hope St Unit 11
- 711 Mount Hope St Unit 12