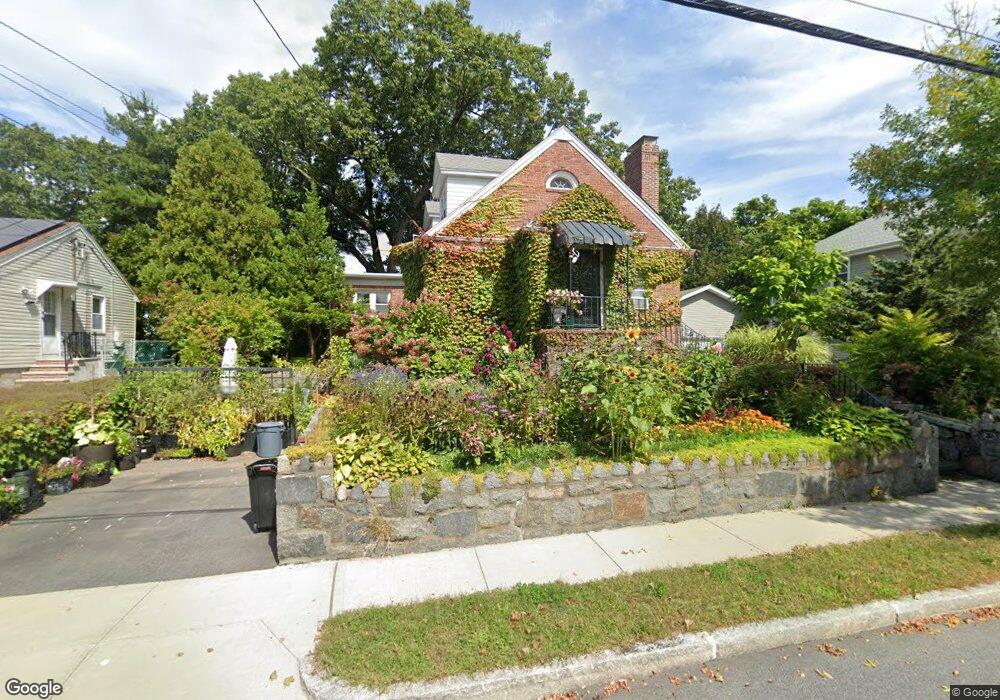
26 Ames St Quincy, MA 02169
Estimated Value: $676,000 - $772,000
2
Beds
1
Bath
1,620
Sq Ft
$446/Sq Ft
Est. Value
About This Home
This home is located at 26 Ames St, Quincy, MA 02169 and is currently estimated at $723,063, approximately $446 per square foot. 26 Ames St is a home located in Norfolk County with nearby schools including South West Middle School, Lincoln-Hancock Community School, and Quincy High School.
Ownership History
Date
Name
Owned For
Owner Type
Purchase Details
Closed on
Jul 30, 2010
Sold by
Ramsey Janice C
Bought by
Morosco Alexia E
Current Estimated Value
Home Financials for this Owner
Home Financials are based on the most recent Mortgage that was taken out on this home.
Original Mortgage
$236,000
Outstanding Balance
$157,901
Interest Rate
4.78%
Mortgage Type
Purchase Money Mortgage
Estimated Equity
$565,162
Purchase Details
Closed on
Mar 25, 2008
Sold by
Ramsey Janice C and Ramsey Robert J
Bought by
Ramsey Janice C
Create a Home Valuation Report for This Property
The Home Valuation Report is an in-depth analysis detailing your home's value as well as a comparison with similar homes in the area
Purchase History
| Date | Buyer | Sale Price | Title Company |
|---|---|---|---|
| Morosco Alexia E | $295,000 | -- | |
| Ramsey Janice C | -- | -- |
Source: Public Records
Mortgage History
| Date | Status | Borrower | Loan Amount |
|---|---|---|---|
| Open | Morosco Alexia E | $236,000 |
Source: Public Records
Tax History
| Year | Tax Paid | Tax Assessment Tax Assessment Total Assessment is a certain percentage of the fair market value that is determined by local assessors to be the total taxable value of land and additions on the property. | Land | Improvement |
|---|---|---|---|---|
| 2025 | $7,380 | $640,100 | $313,900 | $326,200 |
| 2024 | $7,016 | $622,500 | $299,100 | $323,400 |
| 2023 | $6,532 | $586,900 | $285,000 | $301,900 |
| 2022 | $6,257 | $522,300 | $228,300 | $294,000 |
| 2021 | $6,189 | $509,800 | $228,300 | $281,500 |
| 2020 | $6,286 | $505,700 | $228,300 | $277,400 |
| 2019 | $5,840 | $465,300 | $221,800 | $243,500 |
| 2018 | $5,866 | $439,700 | $205,500 | $234,200 |
| 2017 | $5,579 | $393,700 | $195,800 | $197,900 |
| 2016 | $5,195 | $361,800 | $178,200 | $183,600 |
| 2015 | $4,913 | $336,500 | $168,200 | $168,300 |
| 2014 | $4,581 | $308,300 | $163,700 | $144,600 |
Source: Public Records
Map
Nearby Homes
- 510 Willard St
- 36 Village Dr
- 9 Westford St
- 459 Willard St Unit 303
- 87 Village Dr
- 25 McDonald St
- 51 Branch St Unit 2
- 132 Centre St
- 211 Copeland St
- 21 Totman St Unit 308
- 21 Totman St Unit 205
- 21 Totman St Unit 404
- 21 Totman St Unit 309
- 21 Totman St Unit 203
- 21 Totman St Unit PH-406
- 21 Totman St Unit 301
- 21 Totman St Unit PH-405
- 21 Totman St Unit 407
- 57 Buckley St
- 14 Arthur Ave
Your Personal Tour Guide
Ask me questions while you tour the home.