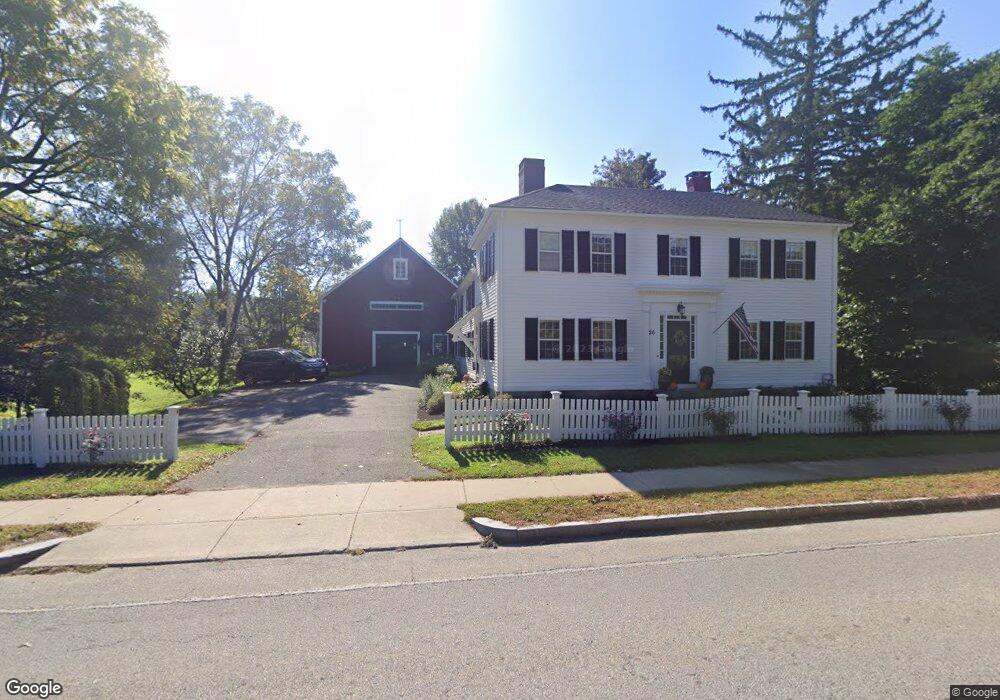
26 Andover St North Andover, MA 01845
Estimated Value: $894,000 - $1,070,000
4
Beds
4
Baths
2,732
Sq Ft
$358/Sq Ft
Est. Value
About This Home
This home is located at 26 Andover St, North Andover, MA 01845 and is currently estimated at $977,503, approximately $357 per square foot. 26 Andover St is a home located in Essex County with nearby schools including Franklin Elementary School, North Andover Middle School, and North Andover High School.
Ownership History
Date
Name
Owned For
Owner Type
Purchase Details
Closed on
Jul 1, 2021
Sold by
Leary Daniel P and Leary Carrie R
Bought by
Leary Ft
Current Estimated Value
Purchase Details
Closed on
Mar 1, 2010
Sold by
Center Rt
Bought by
Leary Daniel P and Leary Carrie R
Home Financials for this Owner
Home Financials are based on the most recent Mortgage that was taken out on this home.
Original Mortgage
$417,000
Interest Rate
5.11%
Mortgage Type
Purchase Money Mortgage
Create a Home Valuation Report for This Property
The Home Valuation Report is an in-depth analysis detailing your home's value as well as a comparison with similar homes in the area
Home Values in the Area
Average Home Value in this Area
Purchase History
| Date | Buyer | Sale Price | Title Company |
|---|---|---|---|
| Leary Ft | -- | None Available | |
| Leary Daniel P | $525,000 | -- |
Source: Public Records
Mortgage History
| Date | Status | Borrower | Loan Amount |
|---|---|---|---|
| Previous Owner | Leary Daniel P | $417,000 |
Source: Public Records
Tax History
| Year | Tax Paid | Tax Assessment Tax Assessment Total Assessment is a certain percentage of the fair market value that is determined by local assessors to be the total taxable value of land and additions on the property. | Land | Improvement |
|---|---|---|---|---|
| 2025 | $9,374 | $832,500 | $344,700 | $487,800 |
| 2024 | $8,879 | $800,600 | $324,400 | $476,200 |
| 2023 | $8,823 | $720,800 | $308,200 | $412,600 |
| 2022 | $8,570 | $633,400 | $279,800 | $353,600 |
| 2021 | $8,254 | $582,500 | $253,400 | $329,100 |
| 2020 | $7,966 | $579,800 | $253,400 | $326,400 |
| 2019 | $7,775 | $579,800 | $253,400 | $326,400 |
| 2018 | $8,424 | $579,800 | $253,400 | $326,400 |
| 2017 | $8,137 | $569,800 | $208,900 | $360,900 |
| 2016 | $7,709 | $540,200 | $207,700 | $332,500 |
| 2015 | $7,676 | $533,400 | $200,400 | $333,000 |
Source: Public Records
Map
Nearby Homes
- 86 Andover St
- 3 Great Pond Rd
- 88 Johnson St
- 42 Hewitt Ave
- 8 Fernview Ave Unit 5
- 30 Fernview Ave Unit 4
- 19 Fernview Ave Unit 6
- 19 Fernview Ave Unit 5
- 124 Quail Run Rd
- 136 Quail Run Rd
- 66 Fernview Ave Unit 9
- 38 Village Green Dr Unit 77
- 70 Farrwood Ave Unit 7
- 115 Mill Pond
- 78 Edgelawn Ave Unit 7
- 60 Edgelawn Ave Unit 1
- 27 Mill Pond
- 36 Kieran Rd
- 12 Mill Pond Unit 12
- 335 Salem St
Your Personal Tour Guide
Ask me questions while you tour the home.