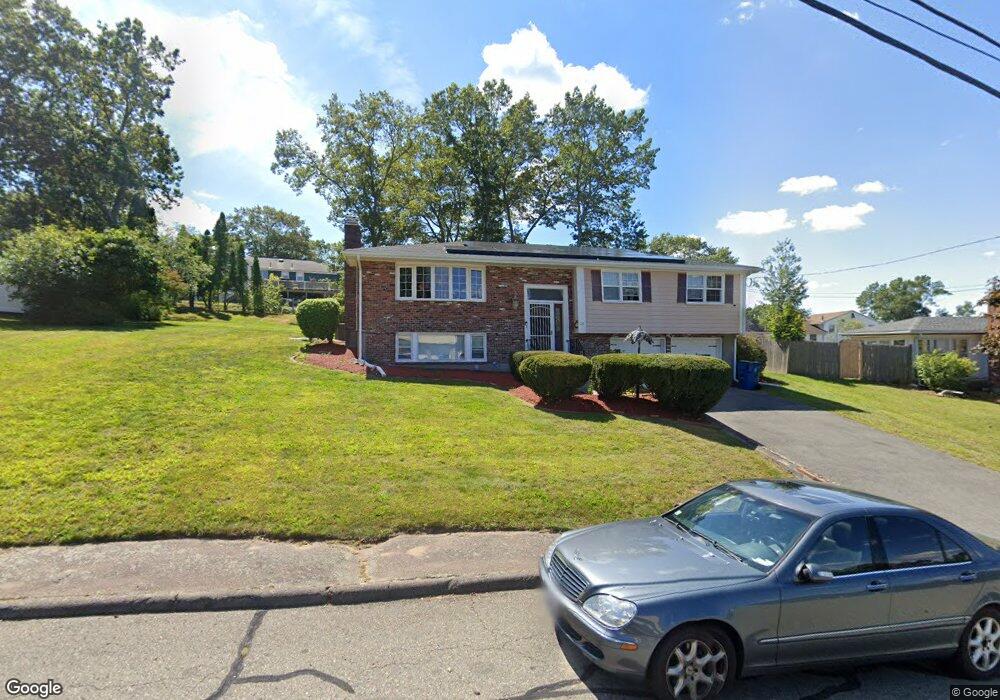
26 Barry St Unit HOUSE Randolph, MA 02368
North Randolph NeighborhoodEstimated Value: $623,204 - $720,000
3
Beds
3
Baths
1,848
Sq Ft
$353/Sq Ft
Est. Value
About This Home
This home is located at 26 Barry St Unit HOUSE, Randolph, MA 02368 and is currently estimated at $651,801, approximately $352 per square foot. 26 Barry St Unit HOUSE is a home located in Norfolk County with nearby schools including Randolph High School and Thacher Montessori School.
Ownership History
Date
Name
Owned For
Owner Type
Purchase Details
Closed on
Dec 3, 2014
Sold by
Dardompre Ascaille and Dardompre Leonne N
Bought by
Dardompre Leonne N
Current Estimated Value
Purchase Details
Closed on
Aug 29, 2012
Sold by
Metro Cu
Bought by
Metro Credit Union
Purchase Details
Closed on
May 14, 2012
Sold by
Francis Marie N and Metro Cu
Bought by
Metropolitan Cu
Purchase Details
Closed on
Sep 9, 2005
Sold by
Barry Street Rt and Landy
Bought by
Francis Marie N and Francis Yves G
Home Financials for this Owner
Home Financials are based on the most recent Mortgage that was taken out on this home.
Original Mortgage
$300,000
Interest Rate
5.79%
Mortgage Type
Purchase Money Mortgage
Create a Home Valuation Report for This Property
The Home Valuation Report is an in-depth analysis detailing your home's value as well as a comparison with similar homes in the area
Home Values in the Area
Average Home Value in this Area
Purchase History
| Date | Buyer | Sale Price | Title Company |
|---|---|---|---|
| Dardompre Leonne N | -- | -- | |
| Dardompre Leonne N | -- | -- | |
| Metro Credit Union | $220,000 | -- | |
| Metropolitan Cu | $234,600 | -- | |
| Metropolitan Cu | $234,600 | -- | |
| Francis Marie N | $375,000 | -- | |
| Francis Marie N | $375,000 | -- |
Source: Public Records
Mortgage History
| Date | Status | Borrower | Loan Amount |
|---|---|---|---|
| Previous Owner | Francis Marie N | $300,000 |
Source: Public Records
Tax History Compared to Growth
Tax History
| Year | Tax Paid | Tax Assessment Tax Assessment Total Assessment is a certain percentage of the fair market value that is determined by local assessors to be the total taxable value of land and additions on the property. | Land | Improvement |
|---|---|---|---|---|
| 2025 | $6,284 | $541,300 | $254,000 | $287,300 |
| 2024 | $6,154 | $537,500 | $249,000 | $288,500 |
| 2023 | $5,838 | $483,300 | $226,400 | $256,900 |
| 2022 | $5,613 | $412,700 | $188,700 | $224,000 |
| 2021 | $5,378 | $363,900 | $157,400 | $206,500 |
| 2020 | $5,409 | $362,800 | $157,400 | $205,400 |
| 2019 | $5,321 | $355,200 | $149,800 | $205,400 |
| 2018 | $5,252 | $330,700 | $136,200 | $194,500 |
| 2017 | $4,875 | $301,300 | $129,600 | $171,700 |
| 2016 | $4,942 | $284,200 | $117,900 | $166,300 |
| 2015 | $4,840 | $267,400 | $112,200 | $155,200 |
Source: Public Records
Map
Nearby Homes
- 902 Irving Rd Unit 902
- 232 Canton St Unit 104
- 232 Canton St Unit 112
- 10 Michael Rd
- 33 Michael Rd
- 304 High St
- 79 Gold St
- 23 Emeline St
- 229 Chestnut St
- 15 Kensington Dr
- 68 High St
- 11 Royal Crest Dr Unit 5
- 9 Royal Crest Dr Unit 12
- 1277 N Main St
- 2 Smith Rd
- 43 Emily Jeffers Rd
- 11 Rockefeller St
- 12 Webster St
- 7 Webster St
- 3 Spotted Turtle Path Unit 24-2