Estimated Value: $613,818 - $740,000
3
Beds
1
Bath
960
Sq Ft
$703/Sq Ft
Est. Value
About This Home
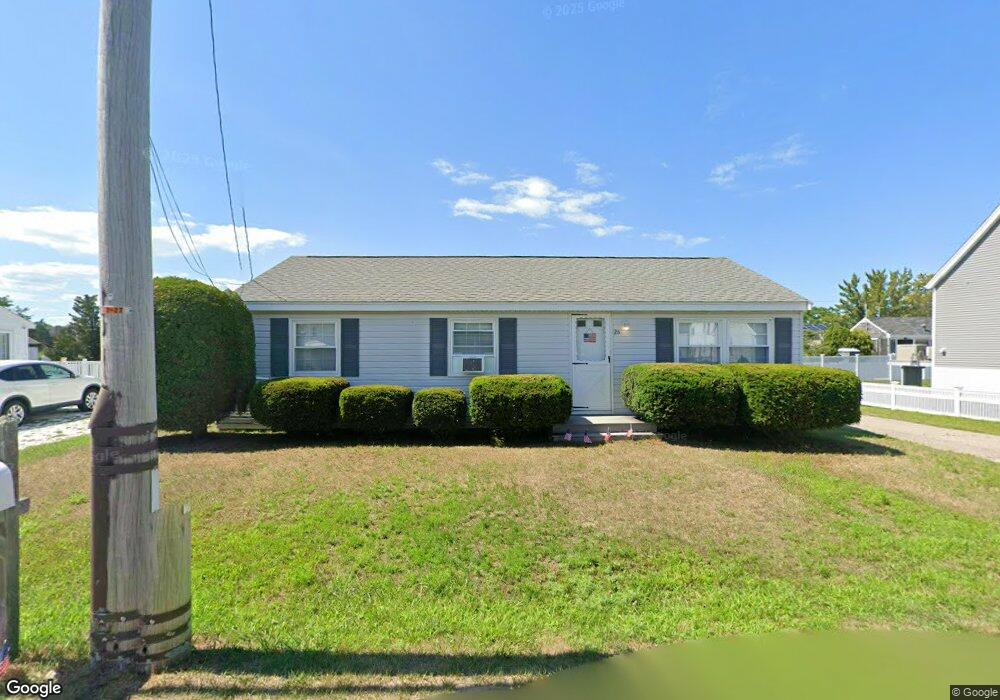
This home is located at 26 Bay St, Marshfield, MA 02050 and is currently estimated at $674,955, approximately $703 per square foot. 26 Bay St is a home located in Plymouth County with nearby schools including Governor Edward Winslow School, Furnace Brook Middle School, and Marshfield High School.
Ownership History
Date
Name
Owned For
Owner Type
Purchase Details
Closed on
Oct 26, 2007
Sold by
Watts Beverly A
Bought by
Pegurri Michael R and Pegurri Gloria G
Current Estimated Value
Home Financials for this Owner
Home Financials are based on the most recent Mortgage that was taken out on this home.
Original Mortgage
$341,099
Interest Rate
6.39%
Mortgage Type
Purchase Money Mortgage
Purchase Details
Closed on
Jun 30, 1994
Sold by
Tara Assos Nt and Tedeschi
Bought by
Watts Beverly A
Create a Home Valuation Report for This Property
The Home Valuation Report is an in-depth analysis detailing your home's value as well as a comparison with similar homes in the area
Home Values in the Area
Average Home Value in this Area
Purchase History
| Date | Buyer | Sale Price | Title Company |
|---|---|---|---|
| Pegurri Michael R | $379,000 | -- | |
| Pegurri Michael R | $379,000 | -- | |
| Watts Beverly A | $114,000 | -- |
Source: Public Records
Mortgage History
| Date | Status | Borrower | Loan Amount |
|---|---|---|---|
| Open | Watts Beverly A | $304,266 | |
| Closed | Watts Beverly A | $304,000 | |
| Closed | Watts Beverly A | $341,099 |
Source: Public Records
Tax History Compared to Growth
Tax History
| Year | Tax Paid | Tax Assessment Tax Assessment Total Assessment is a certain percentage of the fair market value that is determined by local assessors to be the total taxable value of land and additions on the property. | Land | Improvement |
|---|---|---|---|---|
| 2025 | $5,407 | $546,200 | $379,600 | $166,600 |
| 2024 | $5,287 | $508,900 | $359,600 | $149,300 |
| 2023 | $4,701 | $447,700 | $311,600 | $136,100 |
| 2022 | $4,701 | $363,000 | $249,700 | $113,300 |
| 2021 | $4,669 | $354,000 | $249,700 | $104,300 |
| 2020 | $4,692 | $352,000 | $249,700 | $102,300 |
| 2019 | $4,561 | $340,900 | $249,700 | $91,200 |
| 2018 | $3,984 | $298,000 | $209,800 | $88,200 |
| 2017 | $3,973 | $289,600 | $209,800 | $79,800 |
| 2016 | $3,899 | $280,900 | $209,800 | $71,100 |
| 2015 | $3,521 | $264,900 | $199,800 | $65,100 |
| 2014 | $3,620 | $272,400 | $209,800 | $62,600 |
Source: Public Records
Map
Nearby Homes
- 71 Gurnet Rd
- 106 Careswell St
- 57 Island St
- 5 Adelaide Way
- 256 Ocean St
- 78 Tower Ave
- 335 Ocean St
- 328 Ocean St
- 90 Presidential Cir
- 74 Abrams Hill Rd
- 236 Powder Point Ave
- 68 Abrams Hill Rd
- 39 Bay Pond Rd
- 387 Lot 2A Old Cove Rd
- 387 Lot 3A Old Cove Rd
- 387 Lot 4A Old Cove Rd
- 24 Second (2nd) Rd
- 19 2nd Rd
- 32 Gratto Rd
- 10 Hawthorn Hill