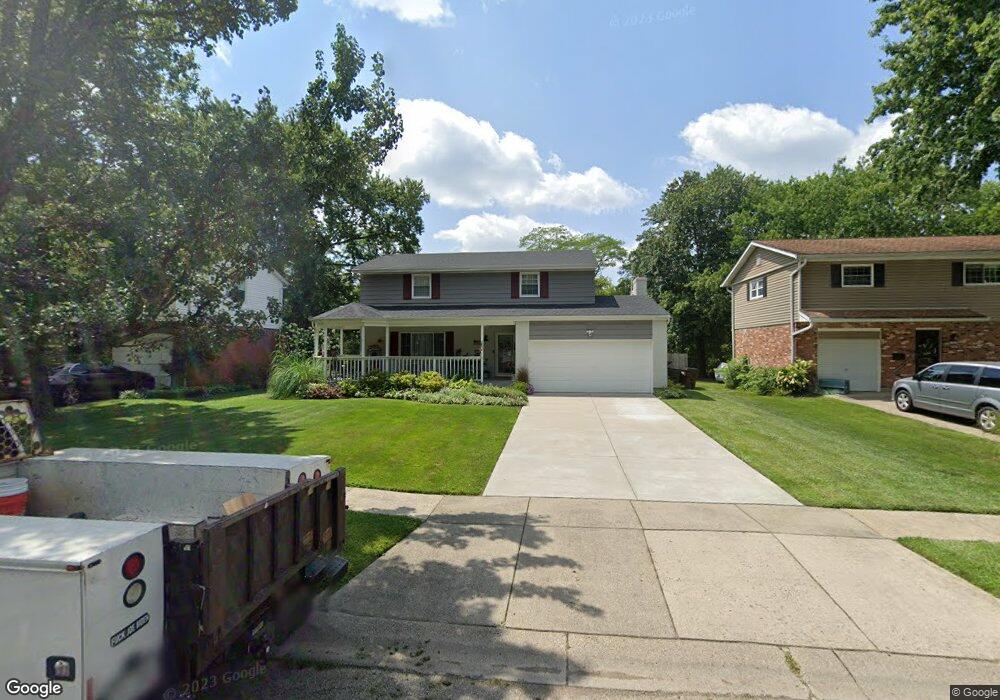
26 Beckford Dr Cincinnati, OH 45218
Estimated Value: $240,000 - $284,000
4
Beds
3
Baths
2,268
Sq Ft
$118/Sq Ft
Est. Value
About This Home
This home is located at 26 Beckford Dr, Cincinnati, OH 45218 and is currently estimated at $268,748, approximately $118 per square foot. 26 Beckford Dr is a home located in Hamilton County with nearby schools including Central Montessori Academy and John Paul II Catholic School.
Ownership History
Date
Name
Owned For
Owner Type
Purchase Details
Closed on
Aug 16, 2001
Sold by
Barnes Robin D
Bought by
Peters James A and Peters Jennifer L
Current Estimated Value
Home Financials for this Owner
Home Financials are based on the most recent Mortgage that was taken out on this home.
Original Mortgage
$109,200
Outstanding Balance
$42,997
Interest Rate
7.28%
Estimated Equity
$225,751
Purchase Details
Closed on
Apr 20, 1998
Sold by
Brimelow Ivor and Brimelow Elana
Bought by
Barnes Robin D
Create a Home Valuation Report for This Property
The Home Valuation Report is an in-depth analysis detailing your home's value as well as a comparison with similar homes in the area
Home Values in the Area
Average Home Value in this Area
Purchase History
| Date | Buyer | Sale Price | Title Company |
|---|---|---|---|
| Peters James A | $136,500 | Insured Land Title Agency | |
| Barnes Robin D | $123,500 | First Data Systems Inc |
Source: Public Records
Mortgage History
| Date | Status | Borrower | Loan Amount |
|---|---|---|---|
| Open | Peters James A | $109,200 | |
| Closed | Peters James A | $13,650 |
Source: Public Records
Tax History Compared to Growth
Tax History
| Year | Tax Paid | Tax Assessment Tax Assessment Total Assessment is a certain percentage of the fair market value that is determined by local assessors to be the total taxable value of land and additions on the property. | Land | Improvement |
|---|---|---|---|---|
| 2024 | $4,717 | $70,886 | $11,718 | $59,168 |
| 2023 | $4,403 | $70,886 | $11,718 | $59,168 |
| 2022 | $4,253 | $51,135 | $10,171 | $40,964 |
| 2021 | $4,166 | $51,135 | $10,171 | $40,964 |
| 2020 | $4,227 | $51,135 | $10,171 | $40,964 |
| 2019 | $4,109 | $43,705 | $8,694 | $35,011 |
| 2018 | $4,118 | $43,705 | $8,694 | $35,011 |
| 2017 | $3,816 | $43,705 | $8,694 | $35,011 |
| 2016 | $3,812 | $42,613 | $9,517 | $33,096 |
| 2015 | $3,580 | $42,613 | $9,517 | $33,096 |
| 2014 | $3,664 | $42,613 | $9,517 | $33,096 |
| 2013 | $3,915 | $46,827 | $10,458 | $36,369 |
Source: Public Records
Map
Nearby Homes