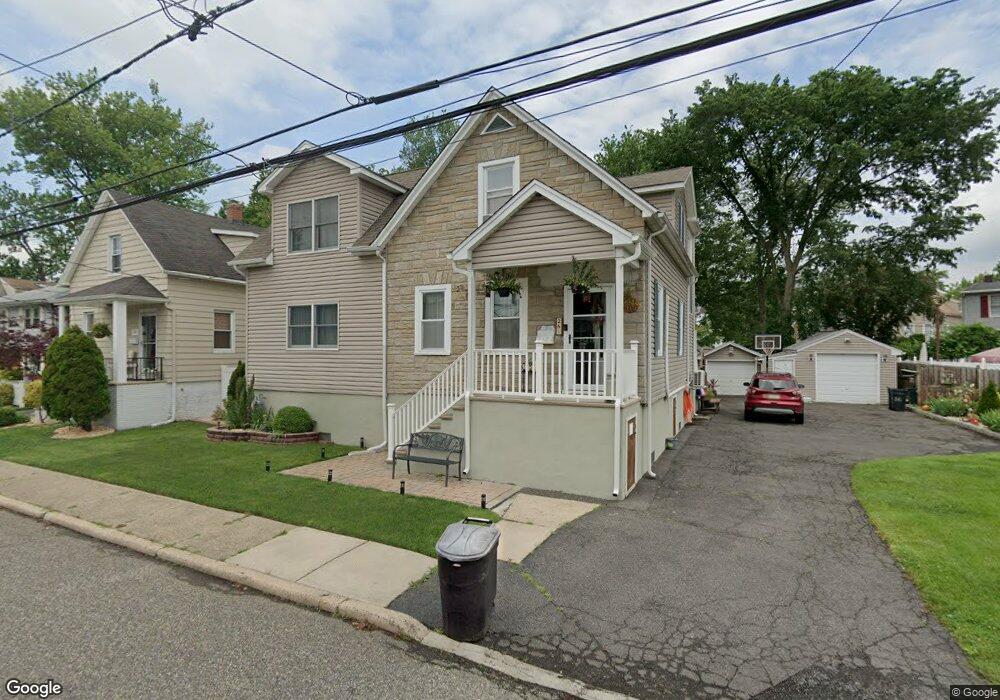
26 Beech St Little Ferry, NJ 07643
Estimated Value: $501,000 - $628,000
--
Bed
--
Bath
1,670
Sq Ft
$345/Sq Ft
Est. Value
About This Home
This home is located at 26 Beech St, Little Ferry, NJ 07643 and is currently estimated at $575,750, approximately $344 per square foot. 26 Beech St is a home located in Bergen County with nearby schools including Memorial Middle School and George Washington School.
Ownership History
Date
Name
Owned For
Owner Type
Purchase Details
Closed on
Nov 7, 2017
Sold by
Coffey Cyril and Coffey Helen
Bought by
Coffey Cyril and Coffey Helen
Current Estimated Value
Home Financials for this Owner
Home Financials are based on the most recent Mortgage that was taken out on this home.
Original Mortgage
$225,000
Outstanding Balance
$115,180
Interest Rate
3.91%
Mortgage Type
Purchase Money Mortgage
Estimated Equity
$460,570
Purchase Details
Closed on
Jul 15, 2003
Sold by
Cagney John
Bought by
Coffey Cyril and Coffey Helen
Home Financials for this Owner
Home Financials are based on the most recent Mortgage that was taken out on this home.
Original Mortgage
$200,000
Interest Rate
5.27%
Purchase Details
Closed on
Oct 7, 1993
Sold by
Deryder David
Bought by
Cagney John
Home Financials for this Owner
Home Financials are based on the most recent Mortgage that was taken out on this home.
Original Mortgage
$102,000
Interest Rate
6.87%
Create a Home Valuation Report for This Property
The Home Valuation Report is an in-depth analysis detailing your home's value as well as a comparison with similar homes in the area
Home Values in the Area
Average Home Value in this Area
Purchase History
| Date | Buyer | Sale Price | Title Company |
|---|---|---|---|
| Coffey Cyril | -- | -- | |
| Coffey Cyril | $250,000 | -- | |
| Cagney John | $113,000 | -- |
Source: Public Records
Mortgage History
| Date | Status | Borrower | Loan Amount |
|---|---|---|---|
| Open | Coffey Cyril | $225,000 | |
| Closed | Coffey Cyril | $200,000 | |
| Previous Owner | Cagney John | $102,000 |
Source: Public Records
Tax History Compared to Growth
Tax History
| Year | Tax Paid | Tax Assessment Tax Assessment Total Assessment is a certain percentage of the fair market value that is determined by local assessors to be the total taxable value of land and additions on the property. | Land | Improvement |
|---|---|---|---|---|
| 2025 | $9,063 | $390,500 | $229,300 | $161,200 |
| 2024 | $8,735 | $361,800 | $204,300 | $157,500 |
| 2023 | $8,700 | $318,000 | $171,800 | $146,200 |
| 2022 | $8,700 | $295,600 | $159,300 | $136,300 |
| 2021 | $8,890 | $274,900 | $149,300 | $125,600 |
| 2020 | $8,674 | $267,400 | $147,300 | $120,100 |
| 2019 | $8,463 | $259,600 | $145,300 | $114,300 |
| 2018 | $8,375 | $253,700 | $143,300 | $110,400 |
| 2017 | $8,356 | $250,100 | $141,800 | $108,300 |
| 2016 | $8,239 | $245,800 | $139,300 | $106,500 |
| 2015 | $8,007 | $239,100 | $134,300 | $104,800 |
| 2014 | $8,980 | $340,800 | $256,400 | $84,400 |
Source: Public Records
Map
Nearby Homes
- 14 Park St
- 17 Chamberlain Ave Unit B
- 70 Main St Unit 1
- 189 Washington Ave
- 12 Brandt St
- 180 Main St
- 78 Poplar Ave
- 23 Grand St
- 48 Main St Unit 1
- 10 Ludwig St Unit HM
- 46 Grand St
- 25 Poplar Ave
- 43 Kaufman Ave
- 89 Liberty St
- 28 Niehaus Ave
- 37 Riverside Ave
- 16 Abend St Unit HM
- 26 Christina St
- 70 Christina St
- 12 Columbus Ave