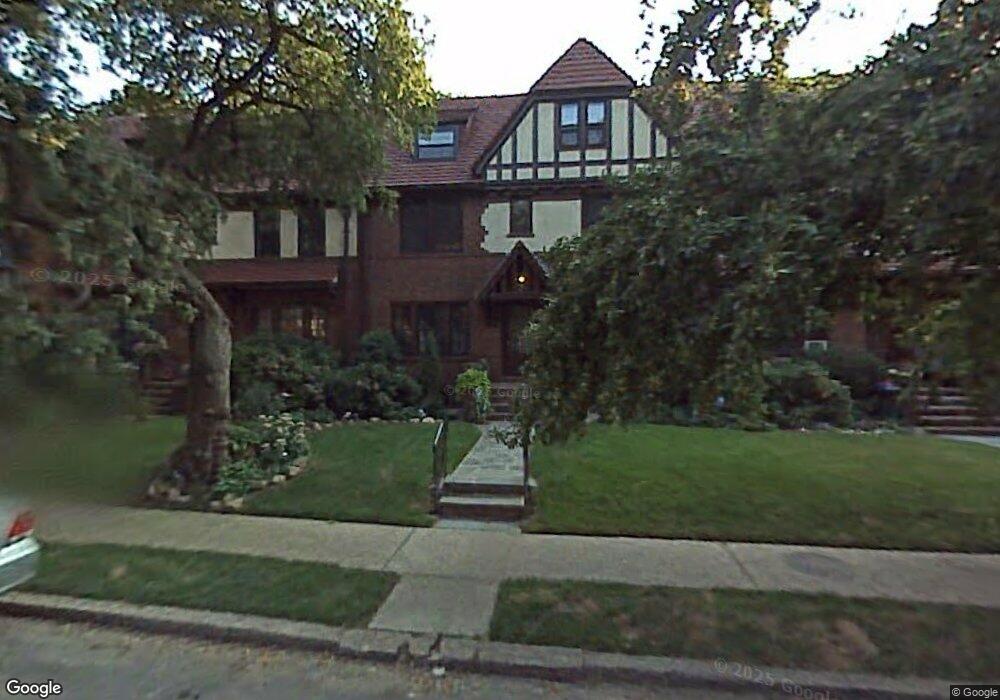
26 Beechknoll Rd Forest Hills, NY 11375
Forest Hills NeighborhoodEstimated Value: $1,845,000 - $2,375,000
2
Beds
1
Bath
2,775
Sq Ft
$734/Sq Ft
Est. Value
About This Home
This home is located at 26 Beechknoll Rd, Forest Hills, NY 11375 and is currently estimated at $2,036,780, approximately $733 per square foot. 26 Beechknoll Rd is a home located in Queens County with nearby schools including Ps 101 School In The Gardens, J.H.S. 190 Russell Sage, and Queens Metropolitan High School.
Ownership History
Date
Name
Owned For
Owner Type
Purchase Details
Closed on
Jul 10, 2015
Sold by
Sieb Irene and Wagner Irene
Bought by
Frank Ariel A
Current Estimated Value
Home Financials for this Owner
Home Financials are based on the most recent Mortgage that was taken out on this home.
Original Mortgage
$1,412,000
Outstanding Balance
$1,107,494
Interest Rate
4.03%
Mortgage Type
Purchase Money Mortgage
Estimated Equity
$929,286
Purchase Details
Closed on
Jun 28, 2005
Sold by
Brzyska Alicia
Bought by
Sieb Irene
Home Financials for this Owner
Home Financials are based on the most recent Mortgage that was taken out on this home.
Original Mortgage
$745,000
Interest Rate
5.67%
Mortgage Type
Purchase Money Mortgage
Purchase Details
Closed on
Aug 19, 2002
Sold by
Windus Janet M
Bought by
Brzyska Alicia
Create a Home Valuation Report for This Property
The Home Valuation Report is an in-depth analysis detailing your home's value as well as a comparison with similar homes in the area
Home Values in the Area
Average Home Value in this Area
Purchase History
| Date | Buyer | Sale Price | Title Company |
|---|---|---|---|
| Frank Ariel A | $1,765,000 | -- | |
| Sieb Irene | $1,445,000 | -- | |
| Brzyska Alicia | -- | -- |
Source: Public Records
Mortgage History
| Date | Status | Borrower | Loan Amount |
|---|---|---|---|
| Open | Frank Ariel A | $1,412,000 | |
| Previous Owner | Sieb Irene | $745,000 |
Source: Public Records
Tax History Compared to Growth
Tax History
| Year | Tax Paid | Tax Assessment Tax Assessment Total Assessment is a certain percentage of the fair market value that is determined by local assessors to be the total taxable value of land and additions on the property. | Land | Improvement |
|---|---|---|---|---|
| 2025 | $17,460 | $92,146 | $14,651 | $77,495 |
| 2024 | $17,460 | $86,930 | $16,563 | $70,367 |
| 2023 | $16,472 | $82,013 | $13,274 | $68,739 |
| 2022 | $16,213 | $130,080 | $20,520 | $109,560 |
| 2021 | $17,092 | $121,740 | $20,520 | $101,220 |
| 2020 | $16,254 | $133,800 | $20,520 | $113,280 |
| 2019 | $15,154 | $147,360 | $20,520 | $126,840 |
| 2018 | $13,932 | $68,344 | $10,927 | $57,417 |
| 2017 | $13,797 | $67,681 | $12,352 | $55,329 |
| 2016 | $13,530 | $67,681 | $12,352 | $55,329 |
| 2015 | $7,481 | $63,991 | $13,383 | $50,608 |
| 2014 | $7,481 | $60,369 | $12,427 | $47,942 |
Source: Public Records
Map
Nearby Homes
- 213 Burns St
- 150 Burns St Unit 2D
- 7344 Austin St Unit 4T
- 73-44 Austin St Unit 5S
- 75-02 Austin St Unit 2J
- 7502 Austin St Unit 1L
- 40 Slocum Crescent
- 75-40 Austin St Unit 2Ar
- 73-20 Austin St Unit 2E
- 73-37 Austin St Unit 2 D
- 73-37 Austin St Unit 6K
- 111-15 75th Ave Unit 2C
- 111-15 75th Ave Unit 1B
- 111-15 75th Ave Unit 6 G
- 111-15 75th Ave Unit 4K
- 11007 73rd Rd Unit 4D
- 11007 73rd Rd Unit 3K
- 111-14 76th Ave Unit 114
- 111-50 75th Rd Unit A54
- 111-50 75th Rd Unit A44
- 30 Beechknoll Rd
- 24 Beechknoll Rd
- 24 Beechknoll Rd Unit 1 Fl
- 24 Beechknoll Rd Unit 2 Fl
- 217 Borage Place
- 20 Beechknoll Rd
- 32 Beechknoll Rd
- 18 Beechknoll Rd
- 68 Greenway N
- 34 Beechknoll Rd
- 72 Greenway N
- 36 Beechknoll Rd
- 62 Greenway N
- 14 Beechknoll Rd
- 18 Park End Place
- 82 Greenway N
- 16 Park End Place
- 12 Beechknoll Rd
- 14 Park End Place
- 60 Greenway N