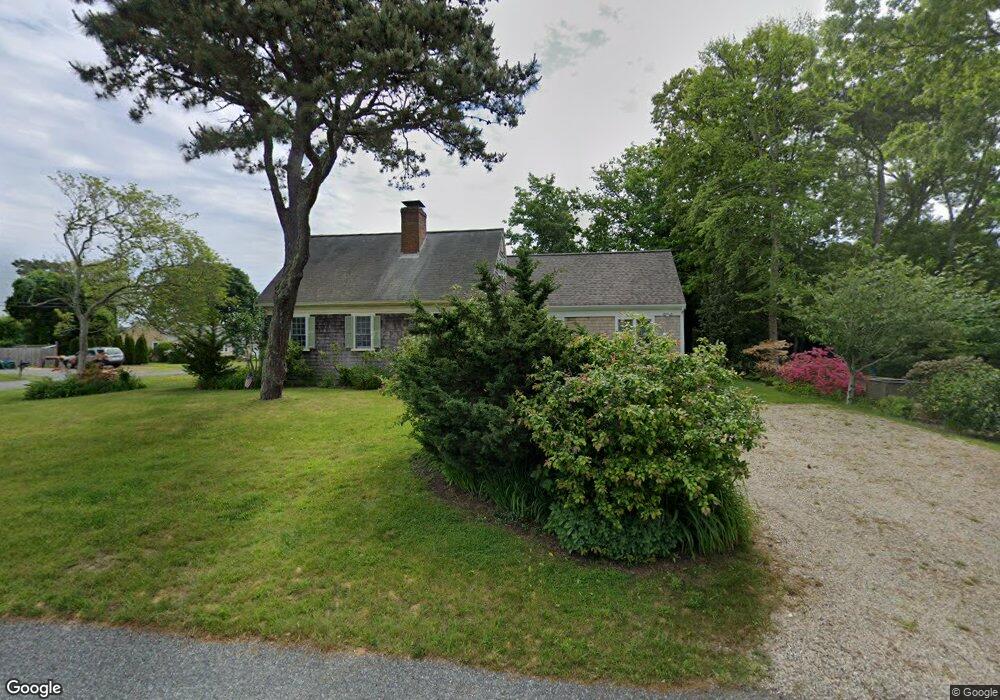
26 Belle of The West Rd Yarmouth Port, MA 02675
Yarmouth Port NeighborhoodEstimated Value: $673,672 - $810,000
2
Beds
3
Baths
1,225
Sq Ft
$614/Sq Ft
Est. Value
About This Home
This home is located at 26 Belle of The West Rd, Yarmouth Port, MA 02675 and is currently estimated at $751,668, approximately $613 per square foot. 26 Belle of The West Rd is a home located in Barnstable County with nearby schools including Dennis-Yarmouth Regional High School, Trinity Christian Academy of Cape Cod, and St. Pius X. School.
Ownership History
Date
Name
Owned For
Owner Type
Purchase Details
Closed on
Aug 19, 2002
Sold by
Bowen Arlene
Bought by
Wilson Margaret and Wilson Stephen
Current Estimated Value
Home Financials for this Owner
Home Financials are based on the most recent Mortgage that was taken out on this home.
Original Mortgage
$239,100
Outstanding Balance
$101,609
Interest Rate
6.61%
Mortgage Type
Purchase Money Mortgage
Estimated Equity
$650,059
Purchase Details
Closed on
Jun 16, 1999
Sold by
Condit Joan
Bought by
Bowen Arlene
Home Financials for this Owner
Home Financials are based on the most recent Mortgage that was taken out on this home.
Original Mortgage
$124,800
Interest Rate
6.99%
Mortgage Type
Purchase Money Mortgage
Create a Home Valuation Report for This Property
The Home Valuation Report is an in-depth analysis detailing your home's value as well as a comparison with similar homes in the area
Home Values in the Area
Average Home Value in this Area
Purchase History
| Date | Buyer | Sale Price | Title Company |
|---|---|---|---|
| Wilson Margaret | $349,000 | -- | |
| Bowen Arlene | $156,000 | -- |
Source: Public Records
Mortgage History
| Date | Status | Borrower | Loan Amount |
|---|---|---|---|
| Open | Wilson Margaret | $239,100 | |
| Previous Owner | Bowen Arlene | $124,800 | |
| Closed | Bowen Arlene | $15,600 |
Source: Public Records
Tax History Compared to Growth
Tax History
| Year | Tax Paid | Tax Assessment Tax Assessment Total Assessment is a certain percentage of the fair market value that is determined by local assessors to be the total taxable value of land and additions on the property. | Land | Improvement |
|---|---|---|---|---|
| 2025 | $4,281 | $604,600 | $298,200 | $306,400 |
| 2024 | $3,943 | $534,300 | $259,300 | $275,000 |
| 2023 | $3,803 | $468,900 | $218,700 | $250,200 |
| 2022 | $3,539 | $385,500 | $196,400 | $189,100 |
| 2021 | $3,420 | $357,700 | $184,500 | $173,200 |
| 2020 | $3,287 | $328,700 | $176,300 | $152,400 |
| 2019 | $3,135 | $310,400 | $176,300 | $134,100 |
| 2018 | $3,103 | $301,600 | $167,500 | $134,100 |
| 2017 | $3,022 | $301,600 | $167,500 | $134,100 |
| 2016 | $3,010 | $301,600 | $167,500 | $134,100 |
| 2015 | $2,916 | $290,400 | $167,500 | $122,900 |
Source: Public Records
Map
Nearby Homes
- 371 Route 6a
- 23 Dauphine Dr
- 186 Route 6a
- 24 Minnetuxet Way
- 162 Route 6a
- 933-935 W Yarmouth Rd
- 116 Main St
- 116 Main (Route 6a) St
- 112 Main St
- 34 Ridgewood Dr
- 882 W Yarmouth Rd
- 56 Wharf Ln
- 105 Old Hyannis Rd
- 2 Pine Grove
- 10 Balsam Way
- 68 Seminole Dr
- 209 Union St
- 25 Oak Glen
- 25 Oak Glen Village Unit 25
- 1 Barnacle Rd
- 26 Belle of the Rd W
- 7 Christopher Hall Way
- 2 Kit Carson Way
- 2 Christopher Hall Way
- 4 Kit Carson Way
- 25 Belle of The West Rd
- 25 Belle of The West Rd
- 31 Belle of The West Rd
- 8 Christopher Hall Way
- 11 Christopher Hall Way
- 21 Belle of The West Rd
- 35 Belle of the Rd W
- 35 Belle of The West Rd
- 0 Kit Carson Way
- 8 Kit Carson Way
- 36 Belle of the Rd W
- 36 Belle of the W
- 36 Belle of The West Rd
- 14 Christopher Hall Way
- 1 Kit Carson Way