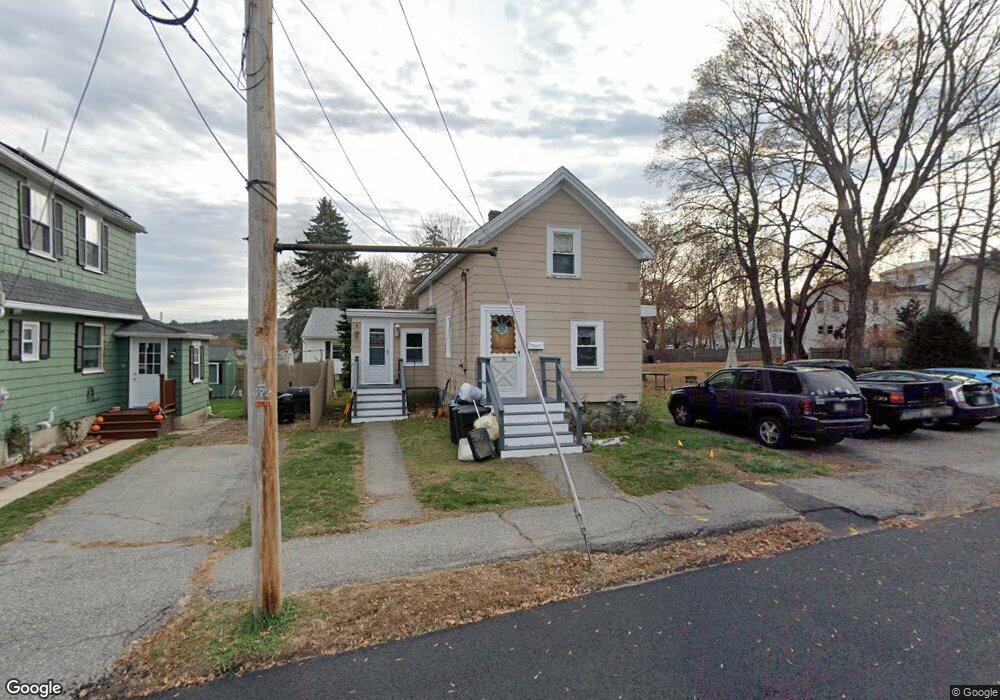
26 Bixby St North Andover, MA 01845
Estimated Value: $486,000 - $576,000
3
Beds
1
Bath
1,003
Sq Ft
$513/Sq Ft
Est. Value
About This Home
This home is located at 26 Bixby St, North Andover, MA 01845 and is currently estimated at $514,853, approximately $513 per square foot. 26 Bixby St is a home located in Essex County with nearby schools including Atkinson Elementary School, North Andover Middle School, and North Andover High School.
Ownership History
Date
Name
Owned For
Owner Type
Purchase Details
Closed on
Jul 30, 2021
Sold by
Lundquist James A and Lundquist Joan
Bought by
Belanger Lisa M
Current Estimated Value
Home Financials for this Owner
Home Financials are based on the most recent Mortgage that was taken out on this home.
Original Mortgage
$230,000
Outstanding Balance
$209,235
Interest Rate
2.93%
Mortgage Type
Purchase Money Mortgage
Estimated Equity
$305,618
Purchase Details
Closed on
Aug 22, 2006
Sold by
Lundquist James A
Bought by
Lundquist James A and Lundquist Joan
Home Financials for this Owner
Home Financials are based on the most recent Mortgage that was taken out on this home.
Original Mortgage
$223,500
Interest Rate
6.88%
Mortgage Type
Purchase Money Mortgage
Purchase Details
Closed on
Oct 12, 2001
Sold by
Lundquist Gilbert D
Bought by
Lundquist James A
Create a Home Valuation Report for This Property
The Home Valuation Report is an in-depth analysis detailing your home's value as well as a comparison with similar homes in the area
Home Values in the Area
Average Home Value in this Area
Purchase History
| Date | Buyer | Sale Price | Title Company |
|---|---|---|---|
| Belanger Lisa M | $350,000 | None Available | |
| Lundquist James A | -- | -- | |
| Lundquist James A | $107,000 | -- |
Source: Public Records
Mortgage History
| Date | Status | Borrower | Loan Amount |
|---|---|---|---|
| Open | Belanger Lisa M | $230,000 | |
| Previous Owner | Lundquist James A | $223,500 | |
| Previous Owner | Lundquist James A | $15,000 |
Source: Public Records
Tax History Compared to Growth
Tax History
| Year | Tax Paid | Tax Assessment Tax Assessment Total Assessment is a certain percentage of the fair market value that is determined by local assessors to be the total taxable value of land and additions on the property. | Land | Improvement |
|---|---|---|---|---|
| 2025 | $5,010 | $444,900 | $289,000 | $155,900 |
| 2024 | $4,697 | $423,500 | $272,000 | $151,500 |
| 2023 | $4,633 | $378,500 | $249,900 | $128,600 |
| 2022 | $4,708 | $348,000 | $224,400 | $123,600 |
| 2021 | $4,503 | $317,800 | $204,000 | $113,800 |
| 2020 | $4,367 | $317,800 | $204,000 | $113,800 |
| 2019 | $4,331 | $323,000 | $204,000 | $119,000 |
| 2018 | $4,693 | $323,000 | $204,000 | $119,000 |
| 2017 | $3,724 | $260,800 | $158,000 | $102,800 |
| 2016 | $3,730 | $261,400 | $155,000 | $106,400 |
| 2015 | $3,436 | $238,800 | $149,700 | $89,100 |
Source: Public Records
Map
Nearby Homes
- 148-150 Water St
- 64 E Water St
- 88 Elm St Unit 1
- 9 Walker Rd Unit 8
- 3 Walker Rd Unit 1
- 12 Walker Rd Unit 6
- 33 Pilgrim St
- 33 Upland St
- 24 Faulkner Rd
- 148 Main St Unit S327
- 148 Main St Unit O102
- 148 Main St Unit A510
- 60 Park St
- 15 Furber Ave
- 4 Stacy Dr Unit 4
- 59 Maple Ave Unit 59
- 11 Putnam Rd
- 8 Little Rd
- 98 Mill Pond
- 84 Mill Pond Unit 84