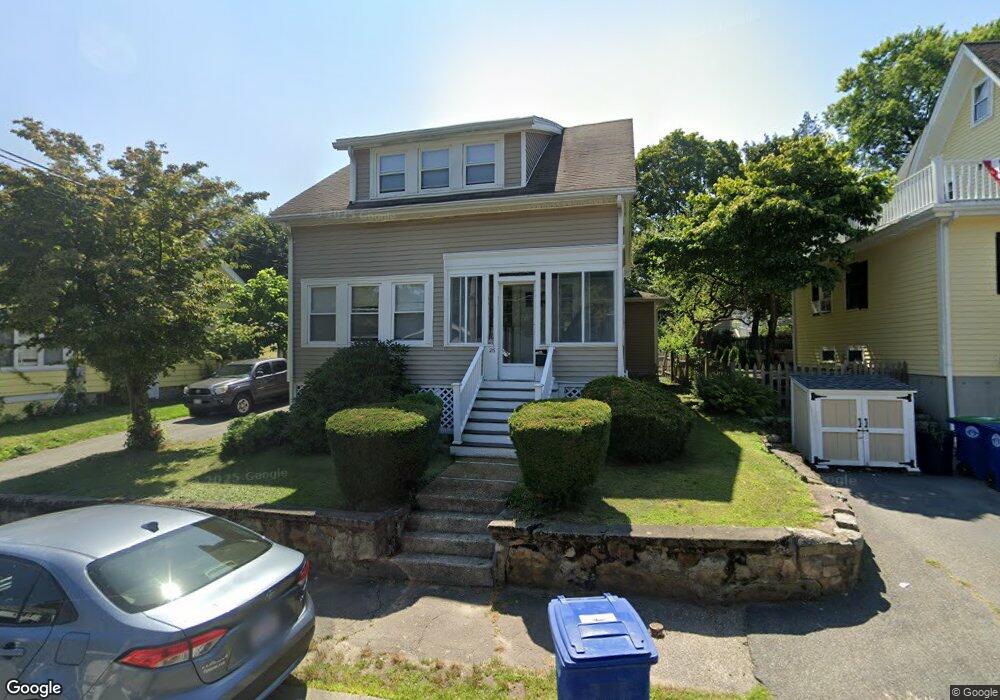
26 Bower Rd Braintree, MA 02184
East Braintree NeighborhoodEstimated Value: $645,802 - $716,000
3
Beds
2
Baths
1,430
Sq Ft
$467/Sq Ft
Est. Value
About This Home
This home is located at 26 Bower Rd, Braintree, MA 02184 and is currently estimated at $667,951, approximately $467 per square foot. 26 Bower Rd is a home located in Norfolk County with nearby schools including Braintree High School, Step Ahead Kindergarten, and Meeting House Montessori School.
Ownership History
Date
Name
Owned For
Owner Type
Purchase Details
Closed on
Dec 27, 2001
Sold by
Ouillette Barbara
Bought by
Mcgovern John M and Mcgovern Susan M
Current Estimated Value
Home Financials for this Owner
Home Financials are based on the most recent Mortgage that was taken out on this home.
Original Mortgage
$200,000
Interest Rate
6.61%
Mortgage Type
Purchase Money Mortgage
Purchase Details
Closed on
Apr 21, 1998
Sold by
Mcgowan Edward J and Mcgowan Jayne C
Bought by
Mullen Christopher P
Home Financials for this Owner
Home Financials are based on the most recent Mortgage that was taken out on this home.
Original Mortgage
$162,201
Interest Rate
7.11%
Mortgage Type
Purchase Money Mortgage
Create a Home Valuation Report for This Property
The Home Valuation Report is an in-depth analysis detailing your home's value as well as a comparison with similar homes in the area
Home Values in the Area
Average Home Value in this Area
Purchase History
| Date | Buyer | Sale Price | Title Company |
|---|---|---|---|
| Mcgovern John M | $267,000 | -- | |
| Mullen Christopher P | $176,000 | -- |
Source: Public Records
Mortgage History
| Date | Status | Borrower | Loan Amount |
|---|---|---|---|
| Open | Mullen Christopher P | $195,000 | |
| Closed | Mcgovern John M | $200,000 | |
| Previous Owner | Mullen Christopher P | $179,000 | |
| Previous Owner | Mullen Christopher P | $162,201 |
Source: Public Records
Tax History
| Year | Tax Paid | Tax Assessment Tax Assessment Total Assessment is a certain percentage of the fair market value that is determined by local assessors to be the total taxable value of land and additions on the property. | Land | Improvement |
|---|---|---|---|---|
| 2025 | $6,206 | $621,800 | $368,400 | $253,400 |
| 2024 | $5,665 | $597,600 | $346,500 | $251,100 |
| 2023 | $5,395 | $552,800 | $315,800 | $237,000 |
| 2022 | $5,239 | $526,500 | $289,500 | $237,000 |
| 2021 | $4,837 | $486,100 | $263,200 | $222,900 |
| 2020 | $4,384 | $444,600 | $231,600 | $213,000 |
| 2019 | $4,252 | $421,400 | $221,900 | $199,500 |
| 2018 | $3,771 | $357,800 | $166,700 | $191,100 |
| 2017 | $3,627 | $337,700 | $157,900 | $179,800 |
| 2016 | $3,431 | $312,500 | $140,400 | $172,100 |
| 2015 | $3,369 | $304,300 | $138,600 | $165,700 |
| 2014 | $3,282 | $287,400 | $134,200 | $153,200 |
Source: Public Records
Map
Nearby Homes
- 342 Elm St
- 17 White Rd
- 255 River St
- 20 Vine St
- 26 Tingley Rd
- 30 Skyline Dr Unit 6
- 9 Independence Ave Unit 307
- 37 Skyline Dr Unit 11
- 192 Federal Ave Unit B
- 300 Commercial St Unit 23
- 25 W Howard St Unit C3
- 312 Shaw St
- 99 Verchild St
- 155 Kendrick Ave Unit 502
- 50 Cleveland Ave
- 14 Hillside Rd
- 599 Union St
- 200 Falls Blvd Unit E101
- 200 Falls Blvd Unit B305
- 200 Falls Blvd Unit I301
Your Personal Tour Guide
Ask me questions while you tour the home.