
Seller's Agent in 2025
Marlena Stachowiak
RE/MAX Preferred
(401) 749-8055
1 in this area
24 Total Sales


Estimated Value: $452,000 - $587,089
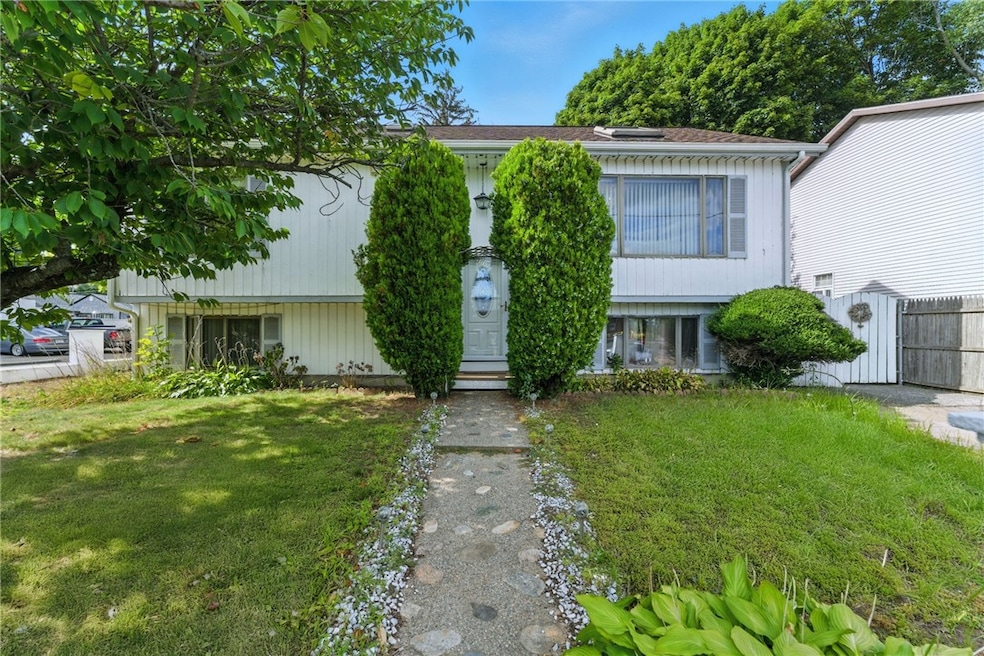
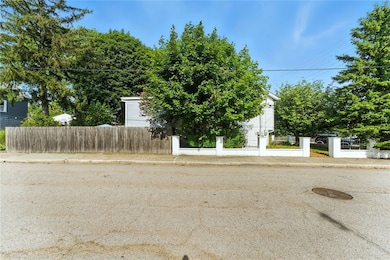
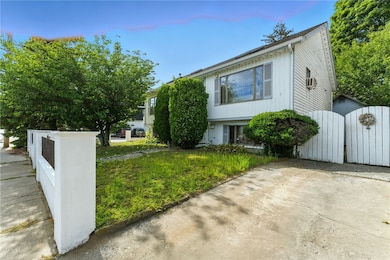
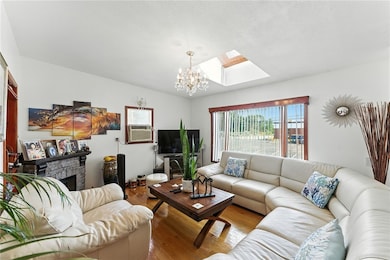
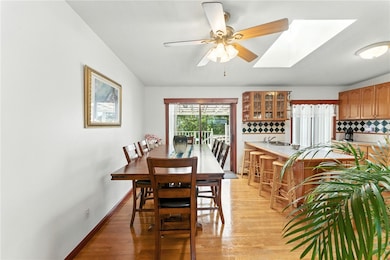
A versatile Raised Ranch offering over 2,300 sq ft of flexible living space. The main level features 2 bedrooms, 2 full baths, skylights, stainless steel appliances, and a primary suite with a walk-in closet. A heated bonus room off the porch makes a perfect office or flex space. The finished lower level includes a second kitchen, full bath, and separate entrance , ideal for multi-generational living or future ADU. The lower level has 1 bedroom with closet and 2 additional bedroom sized rooms. Enjoy a covered porch, above-ground pool, young roof approx. 5 years old, and ample outdoor storage. Located minutes from I-95 and within walking distance to Tidewater Landing, recreation fields, and tennis courts. A commuter-friendly gem with income or extended-living potential!
Last Agent to Sell the Property
RE/MAX Preferred License #RES.0042504 Listed on: 09/23/2025
We collect this data history from publicly available records. To have your information removed, we recommend requesting removal directly through your county’s website.
| Date | Buyer | Sale Price | Title Company |
|---|---|---|---|
| Gorritz Sira N | $453,000 | -- | |
| Matamoros Rafael | $263,000 | -- | |
| Bravo Ivan Dejsus | $90,000 | -- |
We collect this data history from publicly available records. To have your information removed, we recommend requesting removal directly through your county’s website.
| Date | Status | Borrower | Loan Amount |
|---|---|---|---|
| Open | Gorritz Sira N | $439,234 | |
| Previous Owner | Bravo Ivan Dejsus | $238,000 | |
| Previous Owner | Bravo Ivan Dejsus | $17,000 | |
| Previous Owner | Bravo Ivan Dejsus | $243,000 |
| Date | Event | Price | List to Sale | Price per Sq Ft |
|---|---|---|---|---|
| 12/22/2025 12/22/25 | Sold | $453,000 | +0.7% | $196 / Sq Ft |
| 11/06/2025 11/06/25 | Pending | -- | -- | -- |
| 10/20/2025 10/20/25 | For Sale | $449,900 | 0.0% | $194 / Sq Ft |
| 10/03/2025 10/03/25 | Pending | -- | -- | -- |
| 09/23/2025 09/23/25 | For Sale | $449,900 | -- | $194 / Sq Ft |
| Year | Tax Paid | Tax Assessment Tax Assessment Total Assessment is a certain percentage of the fair market value that is determined by local assessors to be the total taxable value of land and additions on the property. | Land | Improvement |
|---|---|---|---|---|
| 2025 | $4,112 | $312,700 | $108,800 | $203,900 |
| 2024 | $3,859 | $312,700 | $108,800 | $203,900 |
| 2023 | $3,972 | $234,500 | $72,500 | $162,000 |
| 2022 | $3,888 | $234,500 | $72,500 | $162,000 |
| 2021 | $3,888 | $234,500 | $72,500 | $162,000 |
| 2020 | $4,051 | $193,900 | $60,400 | $133,500 |
| 2019 | $4,051 | $193,900 | $60,400 | $133,500 |
| 2018 | $3,903 | $193,900 | $60,400 | $133,500 |
| 2017 | $3,817 | $168,000 | $59,800 | $108,200 |
| 2016 | $3,678 | $168,000 | $59,800 | $108,200 |
| 2015 | $3,678 | $168,000 | $59,800 | $108,200 |
| 2014 | $4,070 | $176,500 | $68,300 | $108,200 |
Seller's Agent in 2025
Marlena Stachowiak
RE/MAX Preferred
(401) 749-8055
1 in this area
24 Total Sales
Seller Co-Listing Agent in 2025
Gary Almeida
RE/MAX Preferred
(401) 413-9105
4 in this area
87 Total Sales
B
Buyer's Agent in 2025
Belkys Then
Palma Realty Corporation
2 in this area
6 Total Sales
Source: State-Wide MLS
MLS Number: 1395990
APN: PAWT-000065-000000-000679
Disclaimer: Certain information contained herein is derived from information provided by parties other than Homes.com. All information provided is deemed reliable, but is not guaranteed to be accurate and should be independently verified.
![]() IDX information is provided exclusively for personal, non-commercial use, and may not be used for any purpose other than to identify prospective properties consumers may be interested in purchasing. Information is deemed reliable but not guaranteed.
IDX information is provided exclusively for personal, non-commercial use, and may not be used for any purpose other than to identify prospective properties consumers may be interested in purchasing. Information is deemed reliable but not guaranteed.
Copyright © 2026 State-Wide MLS, Inc. All rights reserved.
Ask me questions while you tour the home.