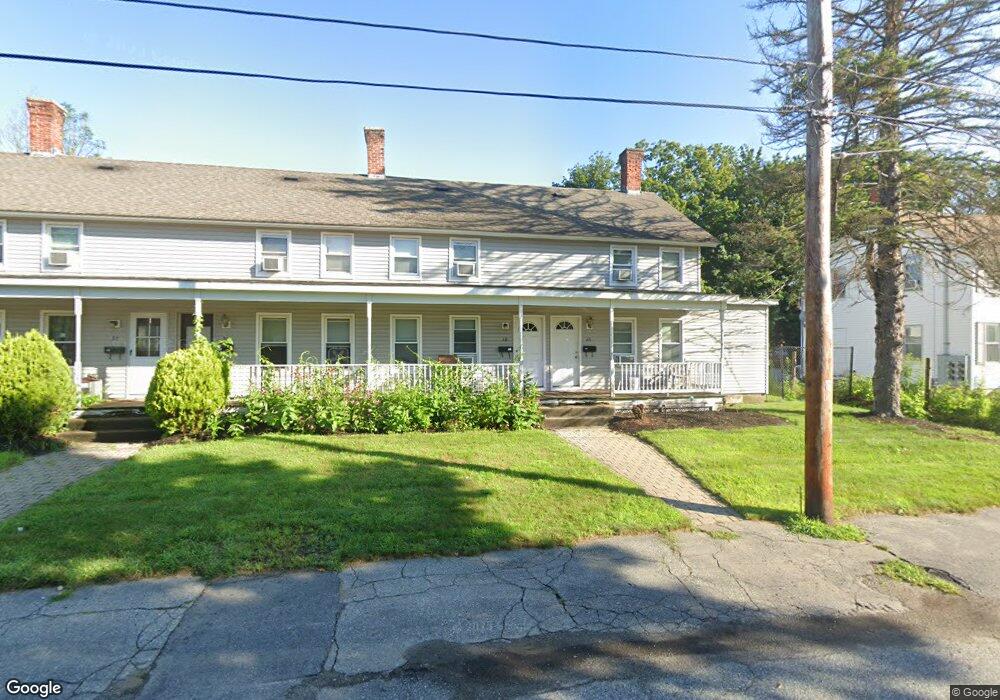
26 C St Unit 26 Whitinsville, MA 01588
Estimated Value: $197,000 - $242,000
2
Beds
1
Bath
824
Sq Ft
$261/Sq Ft
Est. Value
About This Home
This home is located at 26 C St Unit 26, Whitinsville, MA 01588 and is currently estimated at $215,096, approximately $261 per square foot. 26 C St Unit 26 is a home located in Worcester County with nearby schools including Northbridge Elementary School, Northbridge Middle School, and Northbridge High School.
Ownership History
Date
Name
Owned For
Owner Type
Purchase Details
Closed on
Dec 10, 2020
Sold by
Progin Gregory
Bought by
Shackett Patricia A
Current Estimated Value
Home Financials for this Owner
Home Financials are based on the most recent Mortgage that was taken out on this home.
Original Mortgage
$118,752
Outstanding Balance
$105,725
Interest Rate
2.7%
Mortgage Type
New Conventional
Estimated Equity
$109,371
Purchase Details
Closed on
Jun 28, 2011
Sold by
Pianka Zdzislaw J
Bought by
Progin Gregory
Home Financials for this Owner
Home Financials are based on the most recent Mortgage that was taken out on this home.
Original Mortgage
$71,000
Interest Rate
4.63%
Mortgage Type
Purchase Money Mortgage
Purchase Details
Closed on
Apr 15, 2010
Sold by
Joseph Constr Svcs Inc
Bought by
Pianka Zdzislaw L
Create a Home Valuation Report for This Property
The Home Valuation Report is an in-depth analysis detailing your home's value as well as a comparison with similar homes in the area
Home Values in the Area
Average Home Value in this Area
Purchase History
| Date | Buyer | Sale Price | Title Company |
|---|---|---|---|
| Shackett Patricia A | $125,000 | None Available | |
| Shackett Patricia A | $125,000 | None Available | |
| Progin Gregory | $75,000 | -- | |
| Progin Gregory | $75,000 | -- | |
| Pianka Zdzislaw L | $115,000 | -- | |
| Pianka Zdzislaw L | $115,000 | -- |
Source: Public Records
Mortgage History
| Date | Status | Borrower | Loan Amount |
|---|---|---|---|
| Open | Shackett Patricia A | $118,752 | |
| Closed | Shackett Patricia A | $118,752 | |
| Previous Owner | Progin Gregory | $71,000 |
Source: Public Records
Tax History Compared to Growth
Tax History
| Year | Tax Paid | Tax Assessment Tax Assessment Total Assessment is a certain percentage of the fair market value that is determined by local assessors to be the total taxable value of land and additions on the property. | Land | Improvement |
|---|---|---|---|---|
| 2025 | $1,890 | $160,300 | $0 | $160,300 |
| 2024 | $1,643 | $135,900 | $0 | $135,900 |
| 2023 | $1,322 | $102,000 | $0 | $102,000 |
| 2022 | $1,260 | $91,500 | $0 | $91,500 |
| 2021 | $1,161 | $80,100 | $0 | $80,100 |
| 2020 | $1,064 | $76,900 | $0 | $76,900 |
| 2019 | $957 | $73,800 | $0 | $73,800 |
| 2018 | $1,000 | $77,300 | $0 | $77,300 |
| 2017 | $931 | $68,800 | $0 | $68,800 |
| 2016 | $1,077 | $78,300 | $0 | $78,300 |
| 2015 | $1,048 | $78,300 | $0 | $78,300 |
| 2014 | $1,008 | $76,000 | $0 | $76,000 |
Source: Public Records
Map
Nearby Homes
- 14 C St Unit 24
- 14 C St Unit 14
- 2 D St
- 11 A St Unit 11
- 24 Crescent St Unit 6
- 201 Prescott Rd
- 56 Prescott Rd
- 9 Banning Dr
- 46 Rebecca Rd
- 3 Bayliss Way
- Lots 1-9 Spring St
- 1 Elm St
- 192 Rebecca Rd
- 22 Bayliss Way
- 26 Bayliss Way
- 90 Nathaniel Dr
- 86 Kingsnorth St
- 128 Linwood Ave
- 18 East St Unit 24
- 894 Marston Rd