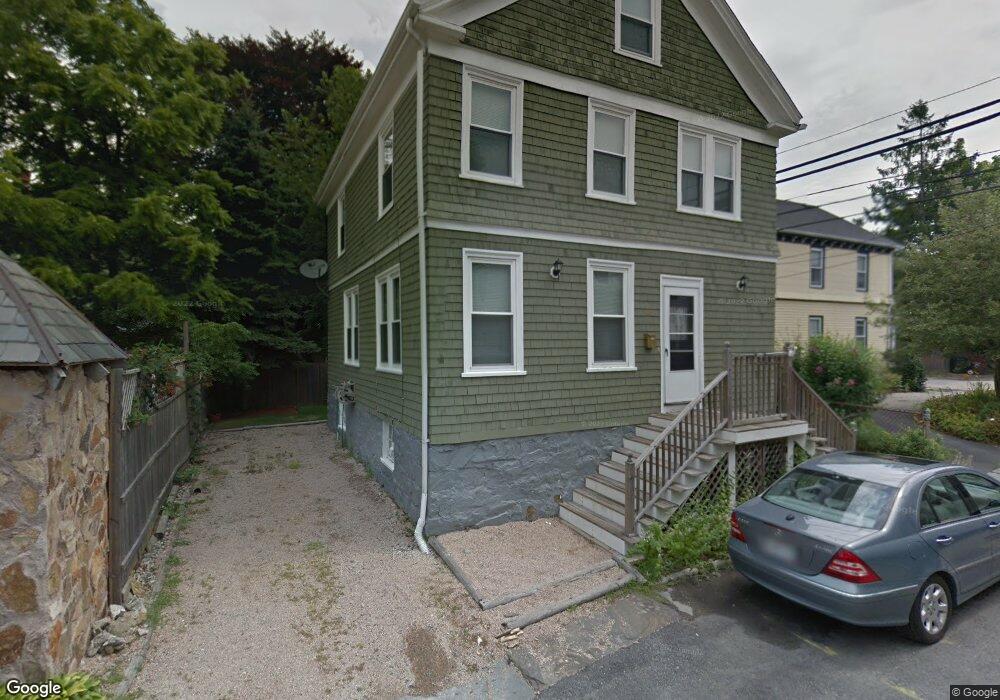
26 Calvert St Unit 1/2 Newport, RI 02840
Kay-Catherine NeighborhoodEstimated Value: $881,000 - $1,486,000
2
Beds
3
Baths
1,833
Sq Ft
$585/Sq Ft
Est. Value
About This Home
This home is located at 26 Calvert St Unit 1/2, Newport, RI 02840 and is currently estimated at $1,071,963, approximately $584 per square foot. 26 Calvert St Unit 1/2 is a home located in Newport County with nearby schools including Rogers High School, St Michael's Country Day School, and St George's School.
Ownership History
Date
Name
Owned For
Owner Type
Purchase Details
Closed on
Nov 16, 2020
Sold by
Walker Martyn F and Walker E F
Bought by
Martyn F & E F Walker Lt
Current Estimated Value
Purchase Details
Closed on
Dec 12, 2008
Sold by
Thomas & Thomas Dev
Bought by
Moneymaker Thomas A
Home Financials for this Owner
Home Financials are based on the most recent Mortgage that was taken out on this home.
Original Mortgage
$364,500
Interest Rate
6.49%
Mortgage Type
Purchase Money Mortgage
Purchase Details
Closed on
Nov 7, 2007
Sold by
Pelletier Pamela
Bought by
Thomas & Thomas Dev
Home Financials for this Owner
Home Financials are based on the most recent Mortgage that was taken out on this home.
Original Mortgage
$227,000
Interest Rate
6.47%
Mortgage Type
Purchase Money Mortgage
Create a Home Valuation Report for This Property
The Home Valuation Report is an in-depth analysis detailing your home's value as well as a comparison with similar homes in the area
Home Values in the Area
Average Home Value in this Area
Purchase History
| Date | Buyer | Sale Price | Title Company |
|---|---|---|---|
| Martyn F & E F Walker Lt | -- | None Available | |
| Moneymaker Thomas A | $405,000 | -- | |
| Thomas & Thomas Dev | $115,000 | -- |
Source: Public Records
Mortgage History
| Date | Status | Borrower | Loan Amount |
|---|---|---|---|
| Previous Owner | Thomas & Thomas Dev | $292,500 | |
| Previous Owner | Thomas & Thomas Dev | $143,000 | |
| Previous Owner | Thomas & Thomas Dev | $364,500 | |
| Previous Owner | Thomas & Thomas Dev | $227,000 |
Source: Public Records
Tax History Compared to Growth
Tax History
| Year | Tax Paid | Tax Assessment Tax Assessment Total Assessment is a certain percentage of the fair market value that is determined by local assessors to be the total taxable value of land and additions on the property. | Land | Improvement |
|---|---|---|---|---|
| 2025 | $4,956 | $690,300 | $193,000 | $497,300 |
| 2024 | $5,674 | $690,300 | $193,000 | $497,300 |
| 2023 | $4,600 | $463,700 | $136,400 | $327,300 |
| 2022 | $4,456 | $463,700 | $136,400 | $327,300 |
| 2021 | $4,326 | $463,700 | $136,400 | $327,300 |
| 2020 | $3,414 | $332,100 | $126,600 | $205,500 |
| 2019 | $3,414 | $332,100 | $126,600 | $205,500 |
| 2018 | $3,318 | $332,100 | $126,600 | $205,500 |
| 2017 | $2,925 | $260,900 | $97,300 | $163,600 |
| 2016 | $2,852 | $260,900 | $97,300 | $163,600 |
| 2015 | $2,784 | $260,900 | $97,300 | $163,600 |
| 2014 | $2,946 | $244,300 | $97,300 | $147,000 |
Source: Public Records
Map
Nearby Homes
- 17 Everett St
- 17 Lincoln St
- 78 Rhode Island Ave Unit 6
- 78 Rhode Island Ave Unit 8
- 42 Mann Ave
- 39 Powel Ave Unit 2
- 39 Powel Ave Unit 1
- 39 Powel Ave Unit CH
- 23 Mann Ave Unit 4
- 1 Pell St
- 5 Pell St
- 8 Champlin St
- 33 Kay St
- 102 Broadway Unit 2B
- 12 Callender Ave
- 34 Bull St
- 55 Hunter Ave
- 2 Newport Ave Unit B2
- 103 Champlin Place N
- 27 Soar Way
- 26 Calvert St
- 26 1/2 Calvert St
- 28 Calvert St
- 28 Calvert St Unit 3
- 28 Calvert St Unit 1
- 24 Calvert St
- 5 Ashurst Place
- 19 Calvert St
- 15 Calvert St
- 3 Ashurst Place
- 30 Calvert St
- 21 Calvert St
- 21 Calvert St
- 21 Calvert St Unit B
- 21 Calvert St Unit A
- 13 Calvert St
- 22 Calvert St
- 16 Everett St
- 17 Calvert St
- 20 Calvert St