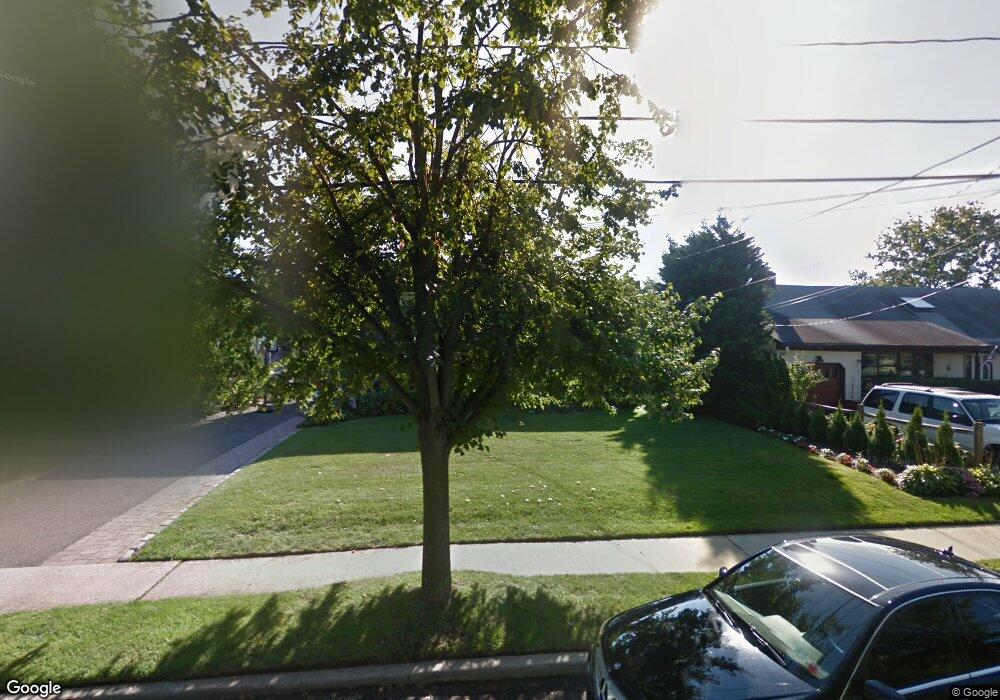
26 Carman St Massapequa, NY 11758
Estimated Value: $782,102 - $792,000
--
Bed
1
Bath
1,999
Sq Ft
$394/Sq Ft
Est. Value
About This Home
This home is located at 26 Carman St, Massapequa, NY 11758 and is currently estimated at $787,051, approximately $393 per square foot. 26 Carman St is a home located in Nassau County with nearby schools including Berner Middle School, Massapequa High School - Ames Campus, and Massapequa High School.
Ownership History
Date
Name
Owned For
Owner Type
Purchase Details
Closed on
Apr 8, 2005
Sold by
Nicholson Travis
Bought by
Delaney John
Current Estimated Value
Purchase Details
Closed on
Jan 7, 2004
Sold by
Nicholson Caroline
Create a Home Valuation Report for This Property
The Home Valuation Report is an in-depth analysis detailing your home's value as well as a comparison with similar homes in the area
Home Values in the Area
Average Home Value in this Area
Purchase History
| Date | Buyer | Sale Price | Title Company |
|---|---|---|---|
| Delaney John | $825,000 | -- | |
| -- | -- | -- |
Source: Public Records
Tax History Compared to Growth
Tax History
| Year | Tax Paid | Tax Assessment Tax Assessment Total Assessment is a certain percentage of the fair market value that is determined by local assessors to be the total taxable value of land and additions on the property. | Land | Improvement |
|---|---|---|---|---|
| 2025 | $15,583 | $575 | $276 | $299 |
| 2024 | $4,552 | $608 | $292 | $316 |
| 2023 | $15,900 | $574 | $275 | $299 |
| 2022 | $15,900 | $609 | $292 | $317 |
| 2021 | $17,611 | $587 | $281 | $306 |
| 2020 | $18,381 | $1,131 | $1,130 | $1 |
| 2019 | $19,048 | $1,131 | $1,130 | $1 |
| 2018 | $17,632 | $1,131 | $0 | $0 |
| 2017 | $10,975 | $1,131 | $965 | $166 |
| 2016 | $15,797 | $1,003 | $812 | $191 |
| 2015 | $3,925 | $1,034 | $837 | $197 |
| 2014 | $3,925 | $1,034 | $837 | $197 |
| 2013 | $4,756 | $1,379 | $1,117 | $262 |
Source: Public Records
Map
Nearby Homes
- 35 Red Oak Place
- 92 Suffolk Rd
- 1 Ozone Place
- 3 Ozone Place
- 86 Unqua Rd
- 75 Unqua Rd
- 21 Oakley Ave
- 15 Major Rd
- 49 Iroquois St E
- 45 Carman Mill Rd
- 20 Quail Run
- 0 Clocks Blvd
- 200 Lot B Clocks Blvd
- 1 Carman Place
- 3 Neptune Place
- 49 S Baldwin Place
- 5 Huron Ave
- 67 Colonial Dr
- 102 Shinnecock Ave
- 108 Block Blvd