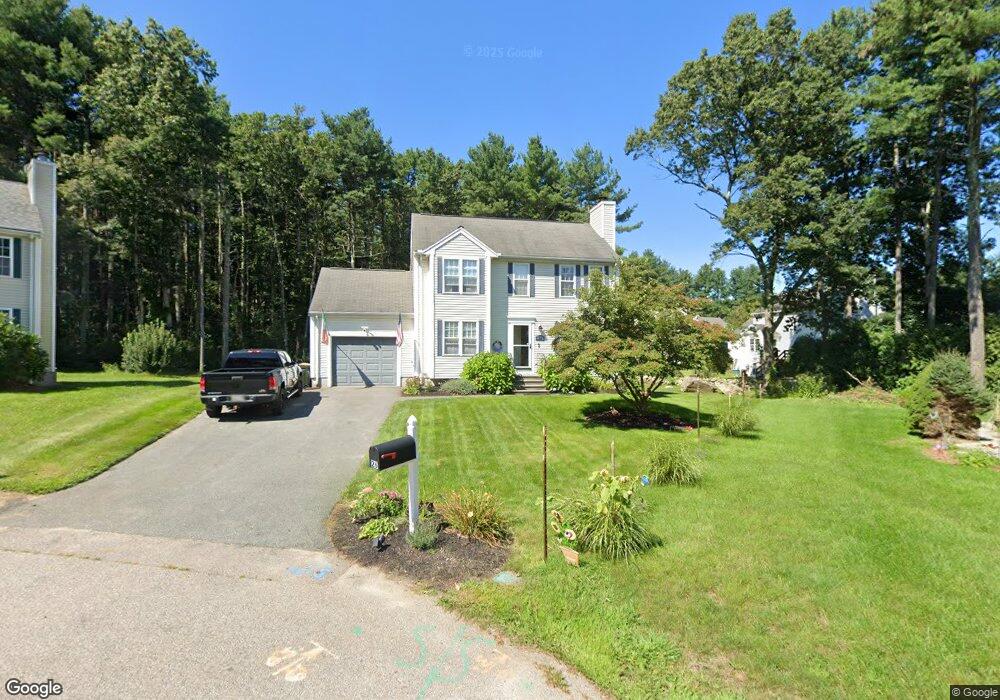
26 Carryville Crossing Bellingham, MA 02019
Estimated Value: $462,000 - $627,000
3
Beds
3
Baths
2,019
Sq Ft
$273/Sq Ft
Est. Value
About This Home
This home is located at 26 Carryville Crossing, Bellingham, MA 02019 and is currently estimated at $552,074, approximately $273 per square foot. 26 Carryville Crossing is a home located in Norfolk County with nearby schools including Stall Brook Elementary School, Bellingham High School, and Bethany Christian Academy.
Ownership History
Date
Name
Owned For
Owner Type
Purchase Details
Closed on
Apr 11, 2016
Sold by
Gillcrist Patricia R
Bought by
Patricia R Gillcrist F R and Patricia Gillcrist
Current Estimated Value
Purchase Details
Closed on
Dec 18, 1997
Sold by
Mungal Anthony G
Bought by
Ouellette Ft
Purchase Details
Closed on
Oct 16, 1996
Sold by
Caryville Rt
Bought by
Gillcrist Robert and Gilcrist Patricia R
Create a Home Valuation Report for This Property
The Home Valuation Report is an in-depth analysis detailing your home's value as well as a comparison with similar homes in the area
Home Values in the Area
Average Home Value in this Area
Purchase History
| Date | Buyer | Sale Price | Title Company |
|---|---|---|---|
| Patricia R Gillcrist F R | -- | -- | |
| Patricia R Gillcrist F | -- | -- | |
| Ouellette Ft | $166,000 | -- | |
| Ouellette Ft | $166,000 | -- | |
| Gillcrist Robert | $159,508 | -- | |
| Gillcrist Robert | $159,508 | -- |
Source: Public Records
Mortgage History
| Date | Status | Borrower | Loan Amount |
|---|---|---|---|
| Previous Owner | Gillcrist Robert | $35,000 | |
| Previous Owner | Gillcrist Robert | $150,900 |
Source: Public Records
Tax History Compared to Growth
Tax History
| Year | Tax Paid | Tax Assessment Tax Assessment Total Assessment is a certain percentage of the fair market value that is determined by local assessors to be the total taxable value of land and additions on the property. | Land | Improvement |
|---|---|---|---|---|
| 2025 | $5,545 | $441,500 | $0 | $441,500 |
| 2024 | $5,422 | $421,600 | $0 | $421,600 |
| 2023 | $5,057 | $387,500 | $0 | $387,500 |
| 2022 | $5,081 | $360,900 | $0 | $360,900 |
| 2021 | $5,140 | $356,700 | $0 | $356,700 |
| 2020 | $4,707 | $331,000 | $0 | $331,000 |
| 2019 | $4,522 | $318,200 | $0 | $318,200 |
| 2018 | $4,483 | $311,100 | $0 | $311,100 |
| 2017 | $4,342 | $302,800 | $0 | $302,800 |
| 2016 | $4,254 | $297,700 | $0 | $297,700 |
| 2015 | $4,242 | $297,700 | $0 | $297,700 |
| 2014 | $4,310 | $294,000 | $0 | $294,000 |
Source: Public Records
Map
Nearby Homes
- 387 Hartford Ave
- 0 Old Log Lane (Farm St) Unit 73416329
- 455 Hartford Ave
- 462 Hartford Ave
- 9 Tulip Way
- 14 Hawthorne Village Unit D
- 39 West St
- 22 Granite St
- 17 Pine St
- 29 Rawson Rd
- 18 Mary Anne Dr
- 951 Pond St
- 6 Rainbow Dr
- 220 Main St Unit 220
- 6 Freedom Trail
- 5 Fales St
- 21 Riverside Rd
- 4 Deerfield Rd
- 22 Roger Belanger Dr
- 78 Fisher St
- 26 Caryville Crossing Unit 26
- 27 Carryville Crossing
- 25 Carryville Crossing
- 28 Caryville Crossing
- 22 Carryville Crossing
- 29 Carryville Crossing
- 22 Caryville Crossing
- 28 Carryville Crossing
- 28 Carryville Crossing Unit 28
- 24 Carryville Crossing
- 20 Caryville Crossing
- 20 Caryville Crossing Unit 20
- 23 Carryville Crossing
- 20 Carryville Crossing
- 20 Carryville Crossing Unit 20
- 21 Carryville Crossing
- 21 Carryville Crossing Unit 21
- 30 Carryville Crossing
- 33 Carryville Crossing
- 15 Caryville Crossing