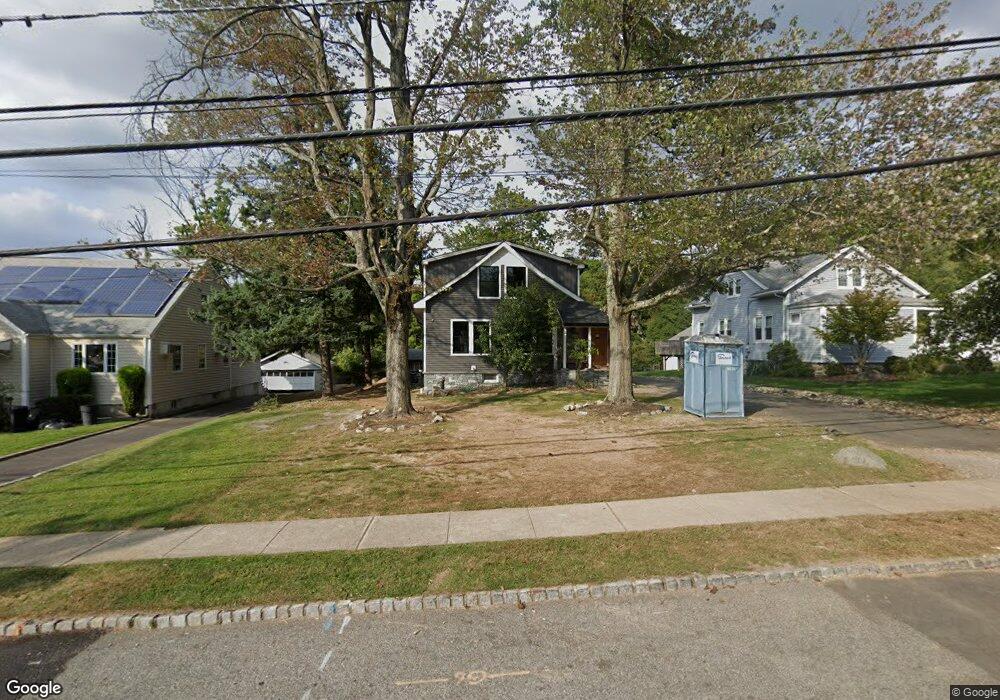
26 Cedar St Cedar Grove, NJ 07009
Estimated Value: $602,000 - $772,000
Studio
--
Bath
1,568
Sq Ft
$450/Sq Ft
Est. Value
About This Home
This home is located at 26 Cedar St, Cedar Grove, NJ 07009 and is currently estimated at $705,853, approximately $450 per square foot. 26 Cedar St is a home located in Essex County with nearby schools including Cedar Grove High School, St Catherine Of Siena School, and St. Cassian School.
Ownership History
Date
Name
Owned For
Owner Type
Purchase Details
Closed on
May 7, 1997
Sold by
Goldsmith David
Bought by
Friel John and Friel Janine
Current Estimated Value
Home Financials for this Owner
Home Financials are based on the most recent Mortgage that was taken out on this home.
Original Mortgage
$179,000
Outstanding Balance
$24,708
Interest Rate
8.09%
Estimated Equity
$681,145
Purchase Details
Closed on
May 28, 1991
Sold by
Graham Gary and Graham Carol
Bought by
Goldsmith Goldsmith J and Goldsmith Suzanne
Create a Home Valuation Report for This Property
The Home Valuation Report is an in-depth analysis detailing your home's value as well as a comparison with similar homes in the area
Home Values in the Area
Average Home Value in this Area
Purchase History
| Date | Buyer | Sale Price | Title Company |
|---|---|---|---|
| Friel John | $199,500 | -- | |
| Goldsmith Goldsmith J | $188,000 | -- |
Source: Public Records
Mortgage History
| Date | Status | Borrower | Loan Amount |
|---|---|---|---|
| Open | Friel John | $179,000 |
Source: Public Records
Tax History
| Year | Tax Paid | Tax Assessment Tax Assessment Total Assessment is a certain percentage of the fair market value that is determined by local assessors to be the total taxable value of land and additions on the property. | Land | Improvement |
|---|---|---|---|---|
| 2025 | $12,239 | $468,200 | $269,500 | $198,700 |
| 2024 | $12,220 | $468,200 | $269,500 | $198,700 |
| 2022 | $12,005 | $468,200 | $269,500 | $198,700 |
| 2021 | $11,860 | $468,200 | $269,500 | $198,700 |
| 2020 | $12,033 | $468,200 | $269,500 | $198,700 |
| 2019 | $11,757 | $468,200 | $269,500 | $198,700 |
| 2018 | $11,218 | $468,200 | $269,500 | $198,700 |
| 2017 | $11,096 | $468,200 | $269,500 | $198,700 |
| 2016 | $10,755 | $468,200 | $269,500 | $198,700 |
| 2015 | $10,506 | $468,200 | $269,500 | $198,700 |
| 2014 | $10,291 | $468,200 | $269,500 | $198,700 |
Source: Public Records
Map
Nearby Homes
Your Personal Tour Guide
Ask me questions while you tour the home.