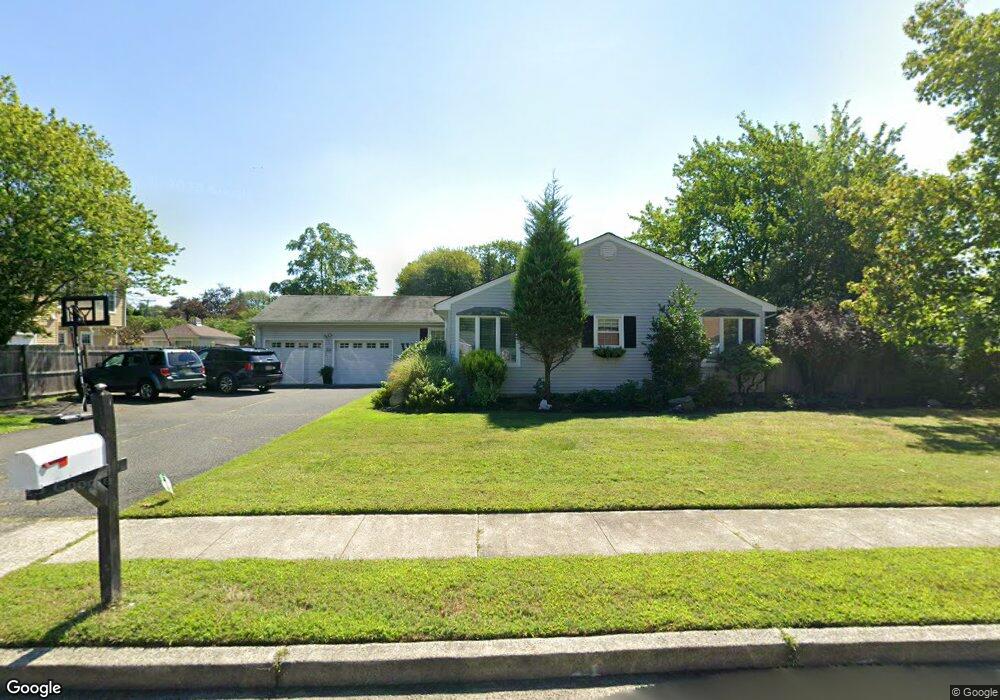
26 Colonial Dr Oceanport, NJ 07757
Estimated Value: $765,000 - $951,000
3
Beds
1
Bath
1,858
Sq Ft
$465/Sq Ft
Est. Value
About This Home
This home is located at 26 Colonial Dr, Oceanport, NJ 07757 and is currently estimated at $864,366, approximately $465 per square foot. 26 Colonial Dr is a home located in Monmouth County with nearby schools including Wolf Hill Elementary School, Maple Place Elementary and Middle School, and Shore Regional High School.
Ownership History
Date
Name
Owned For
Owner Type
Purchase Details
Closed on
Dec 21, 2004
Sold by
Curtis Nile
Bought by
Weber Francesca
Current Estimated Value
Home Financials for this Owner
Home Financials are based on the most recent Mortgage that was taken out on this home.
Original Mortgage
$312,700
Outstanding Balance
$154,197
Interest Rate
5.5%
Mortgage Type
Adjustable Rate Mortgage/ARM
Estimated Equity
$710,169
Purchase Details
Closed on
Oct 22, 1999
Sold by
Dutoit Peter
Bought by
Curtis Nile and Nile Kathleen
Home Financials for this Owner
Home Financials are based on the most recent Mortgage that was taken out on this home.
Original Mortgage
$199,000
Interest Rate
7.86%
Create a Home Valuation Report for This Property
The Home Valuation Report is an in-depth analysis detailing your home's value as well as a comparison with similar homes in the area
Home Values in the Area
Average Home Value in this Area
Purchase History
| Date | Buyer | Sale Price | Title Company |
|---|---|---|---|
| Weber Francesca | $417,000 | -- | |
| Curtis Nile | $245,000 | -- |
Source: Public Records
Mortgage History
| Date | Status | Borrower | Loan Amount |
|---|---|---|---|
| Open | Weber Francesca | $312,700 | |
| Previous Owner | Curtis Nile | $199,000 |
Source: Public Records
Tax History Compared to Growth
Tax History
| Year | Tax Paid | Tax Assessment Tax Assessment Total Assessment is a certain percentage of the fair market value that is determined by local assessors to be the total taxable value of land and additions on the property. | Land | Improvement |
|---|---|---|---|---|
| 2025 | $9,267 | $619,400 | $376,500 | $242,900 |
| 2024 | $9,072 | $586,900 | $354,500 | $232,400 |
| 2023 | $9,072 | $545,200 | $324,500 | $220,700 |
| 2022 | $9,645 | $518,800 | $324,500 | $194,300 |
| 2021 | $9,645 | $506,300 | $321,500 | $184,800 |
| 2020 | $8,943 | $489,200 | $316,500 | $172,700 |
| 2019 | $8,702 | $483,200 | $316,500 | $166,700 |
| 2018 | $8,609 | $481,200 | $316,500 | $164,700 |
| 2017 | $7,222 | $334,800 | $170,100 | $164,700 |
| 2016 | $7,108 | $331,700 | $170,100 | $161,600 |
| 2015 | $7,056 | $340,200 | $170,100 | $170,100 |
| 2014 | $6,973 | $341,000 | $190,100 | $150,900 |
Source: Public Records
Map
Nearby Homes
- 13 Morris Place
- 66 Shrewsbury Ave
- 15 Signal Ave
- 265 Port Au Peck Ave
- 10 Asbury Ave
- 3 Foggia Way
- 222 Coleman Ave
- 238 Branchport Ave
- 572 Jay St
- 565 Joline Ave
- 8 Pocahontas Ave
- 190 Spruce St Unit 4
- 401 Joline Ave
- 631 Irving Place
- 28 Patten Ln
- 119 Washington St
- 11 Clay St
- 211 Rockwell Ave
- 139 Sixth Ave
- 392 Florence Ave
- 28 Revere Dr
- 480 Branchport Ave
- 476 Branchport Ave
- 24 Colonial Dr
- 484 Branchport Ave
- 30 Revere Dr
- 36 Revere Dr
- 474 Branchport Ave
- 488 Branchport Ave
- 483 Branchport Ave
- 28 Colonial Dr
- 34 Revere Dr
- 475 Branchport Ave
- 471 Branchport Ave
- 489 Branchport Ave
- 492 Branchport Ave
- 32 Revere Dr
- 293 Port Au Peck Ave
- 469 Branchport Ave
- 295 Port Au Peck Ave