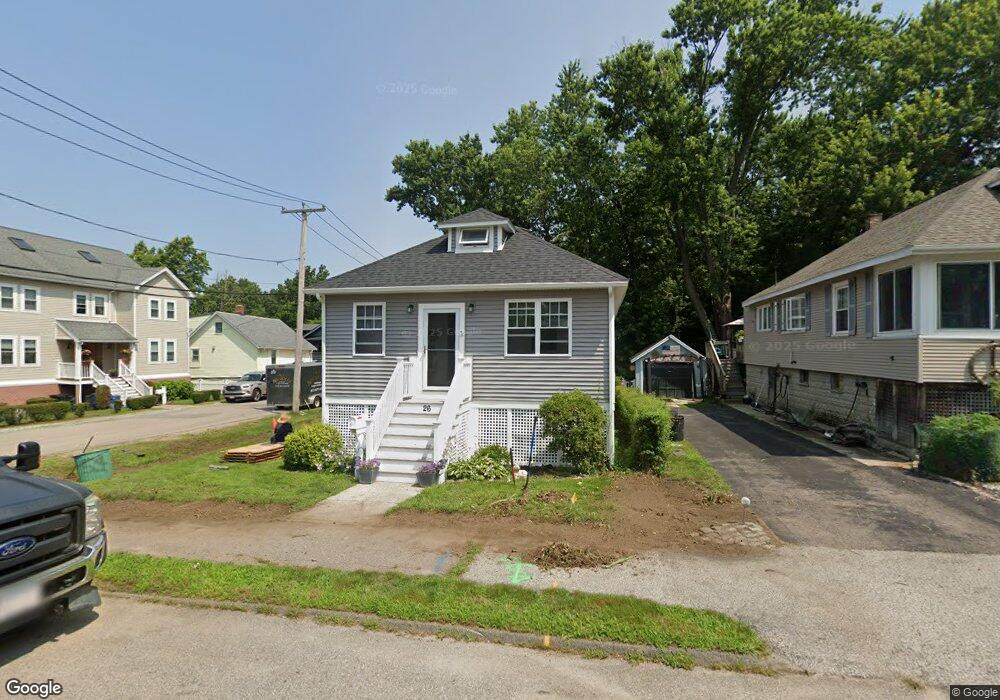
26 Copley St Quincy, MA 02170
Wollaston NeighborhoodEstimated Value: $578,000 - $654,484
2
Beds
1
Bath
1,142
Sq Ft
$537/Sq Ft
Est. Value
About This Home
This home is located at 26 Copley St, Quincy, MA 02170 and is currently estimated at $613,371, approximately $537 per square foot. 26 Copley St is a home located in Norfolk County with nearby schools including Beechwood Knoll Elementary School, Central Middle School, and North Quincy High School.
Ownership History
Date
Name
Owned For
Owner Type
Purchase Details
Closed on
Feb 20, 2025
Sold by
Shaughnessy Martin H and Shaughnessy Patricia A
Bought by
Shaughnessy Ft and Shaughnessy
Current Estimated Value
Purchase Details
Closed on
May 26, 1992
Sold by
Chiavaroli William P and Chivaroli Maura K
Bought by
Shaughnessy Martin H and Shaughnesy Patricia
Purchase Details
Closed on
Dec 30, 1988
Sold by
Moore Ruth V
Bought by
Chiavaroli William
Create a Home Valuation Report for This Property
The Home Valuation Report is an in-depth analysis detailing your home's value as well as a comparison with similar homes in the area
Home Values in the Area
Average Home Value in this Area
Purchase History
| Date | Buyer | Sale Price | Title Company |
|---|---|---|---|
| Shaughnessy Ft | -- | None Available | |
| Shaughnessy Ft | -- | None Available | |
| Shaughnessy Martin H | $103,000 | -- | |
| Shaughnessy Martin H | $103,000 | -- | |
| Chiavaroli William | $122,500 | -- |
Source: Public Records
Mortgage History
| Date | Status | Borrower | Loan Amount |
|---|---|---|---|
| Previous Owner | Chiavaroli William | $77,000 | |
| Previous Owner | Chiavaroli William | $85,000 | |
| Previous Owner | Chiavaroli William | $105,000 |
Source: Public Records
Tax History Compared to Growth
Tax History
| Year | Tax Paid | Tax Assessment Tax Assessment Total Assessment is a certain percentage of the fair market value that is determined by local assessors to be the total taxable value of land and additions on the property. | Land | Improvement |
|---|---|---|---|---|
| 2025 | $6,638 | $575,700 | $324,500 | $251,200 |
| 2024 | $6,392 | $567,200 | $324,500 | $242,700 |
| 2023 | $6,169 | $554,300 | $309,100 | $245,200 |
| 2022 | $5,822 | $486,000 | $247,300 | $238,700 |
| 2021 | $5,257 | $433,000 | $247,300 | $185,700 |
| 2020 | $5,081 | $408,800 | $247,300 | $161,500 |
| 2019 | $4,795 | $382,100 | $231,100 | $151,000 |
| 2018 | $4,669 | $350,000 | $210,100 | $139,900 |
| 2017 | $4,661 | $328,900 | $210,100 | $118,800 |
| 2016 | $4,284 | $298,300 | $191,000 | $107,300 |
| 2015 | $3,938 | $269,700 | $173,600 | $96,100 |
| 2014 | $3,768 | $253,600 | $165,300 | $88,300 |
Source: Public Records
Map
Nearby Homes
- 41 Randlett St
- 14 Ridgeway St
- 65 - 67 Davis St
- 158 W Elm Ave
- 123 Waterston Ave
- 176 W Elm Ave
- 101 Beach St
- 72 Waterston Ave
- 100 Thornton St
- 237 Billings Rd
- 22 Beach St
- 43 Ellington Rd
- 35 Estabrook Rd
- 522 Hancock St
- 511 Hancock St Unit 207
- 21 Linden St Unit 417
- 22 Newton Ave
- 55 Warren Ave
- 14 Maypole Rd
- 88 Furnace Brook Pkwy