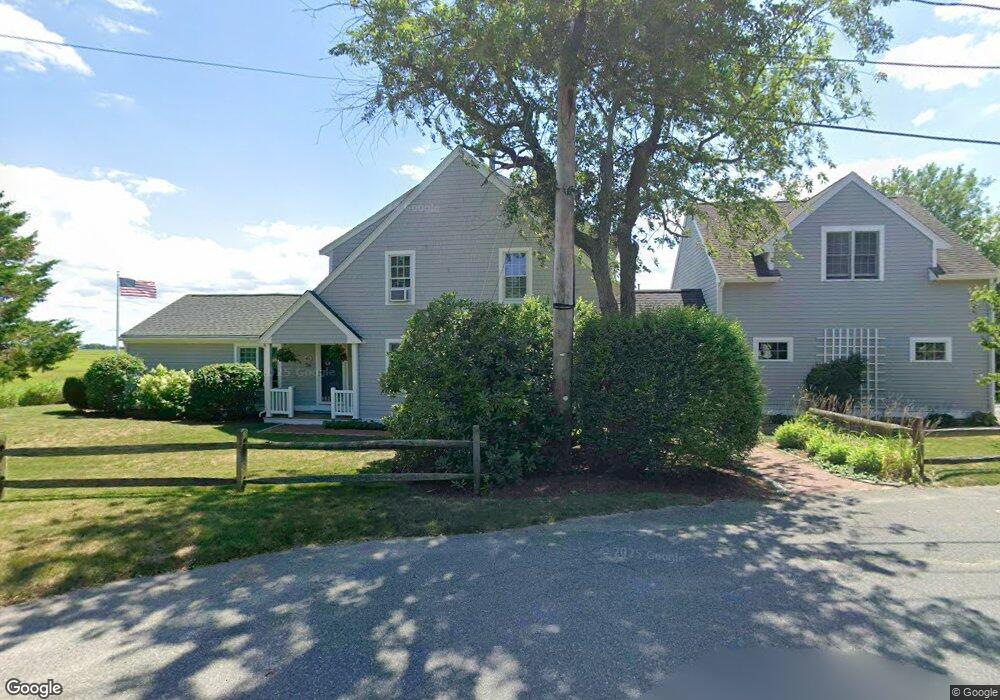
26 Craddock Rd Marshfield, MA 02050
Green Harbor-Cedar Crest NeighborhoodEstimated Value: $851,718 - $913,000
4
Beds
2
Baths
2,518
Sq Ft
$353/Sq Ft
Est. Value
About This Home
This home is located at 26 Craddock Rd, Marshfield, MA 02050 and is currently estimated at $888,680, approximately $352 per square foot. 26 Craddock Rd is a home located in Plymouth County with nearby schools including Governor Edward Winslow School, Furnace Brook Middle School, and Marshfield High School.
Ownership History
Date
Name
Owned For
Owner Type
Purchase Details
Closed on
Aug 1, 2024
Sold by
Hubbard Jay F and Hubbard Carolyn J
Bought by
Jay & Carolyn Hubbad Ret and Hubbard
Current Estimated Value
Purchase Details
Closed on
Mar 19, 1990
Sold by
Bourget Susan
Bought by
Hubbard Jay F
Home Financials for this Owner
Home Financials are based on the most recent Mortgage that was taken out on this home.
Original Mortgage
$80,000
Interest Rate
10.02%
Mortgage Type
Purchase Money Mortgage
Create a Home Valuation Report for This Property
The Home Valuation Report is an in-depth analysis detailing your home's value as well as a comparison with similar homes in the area
Home Values in the Area
Average Home Value in this Area
Purchase History
| Date | Buyer | Sale Price | Title Company |
|---|---|---|---|
| Jay & Carolyn Hubbad Ret | -- | None Available | |
| Jay & Carolyn Hubbad Ret | -- | None Available | |
| Jay & Carolyn Hubbad Ret | -- | None Available | |
| Hubbard Jay F | $100,000 | -- |
Source: Public Records
Mortgage History
| Date | Status | Borrower | Loan Amount |
|---|---|---|---|
| Previous Owner | Hubbard Jay F | $70,500 | |
| Previous Owner | Hubbard Jay F | $85,000 | |
| Previous Owner | Hubbard Jay F | $85,500 | |
| Previous Owner | Hubbard Jay F | $80,000 |
Source: Public Records
Tax History Compared to Growth
Tax History
| Year | Tax Paid | Tax Assessment Tax Assessment Total Assessment is a certain percentage of the fair market value that is determined by local assessors to be the total taxable value of land and additions on the property. | Land | Improvement |
|---|---|---|---|---|
| 2025 | $7,133 | $720,500 | $342,800 | $377,700 |
| 2024 | $6,951 | $669,000 | $322,600 | $346,400 |
| 2023 | $6,516 | $593,100 | $290,400 | $302,700 |
| 2022 | $6,516 | $503,200 | $242,000 | $261,200 |
| 2021 | $6,309 | $478,300 | $242,000 | $236,300 |
| 2020 | $5,888 | $441,700 | $211,700 | $230,000 |
| 2019 | $5,743 | $429,200 | $211,700 | $217,500 |
| 2018 | $5,684 | $425,100 | $211,700 | $213,400 |
| 2017 | $5,565 | $405,600 | $211,700 | $193,900 |
| 2016 | $5,455 | $393,000 | $211,700 | $181,300 |
| 2015 | $5,036 | $378,900 | $201,700 | $177,200 |
| 2014 | $5,075 | $381,900 | $211,700 | $170,200 |
Source: Public Records
Map
Nearby Homes