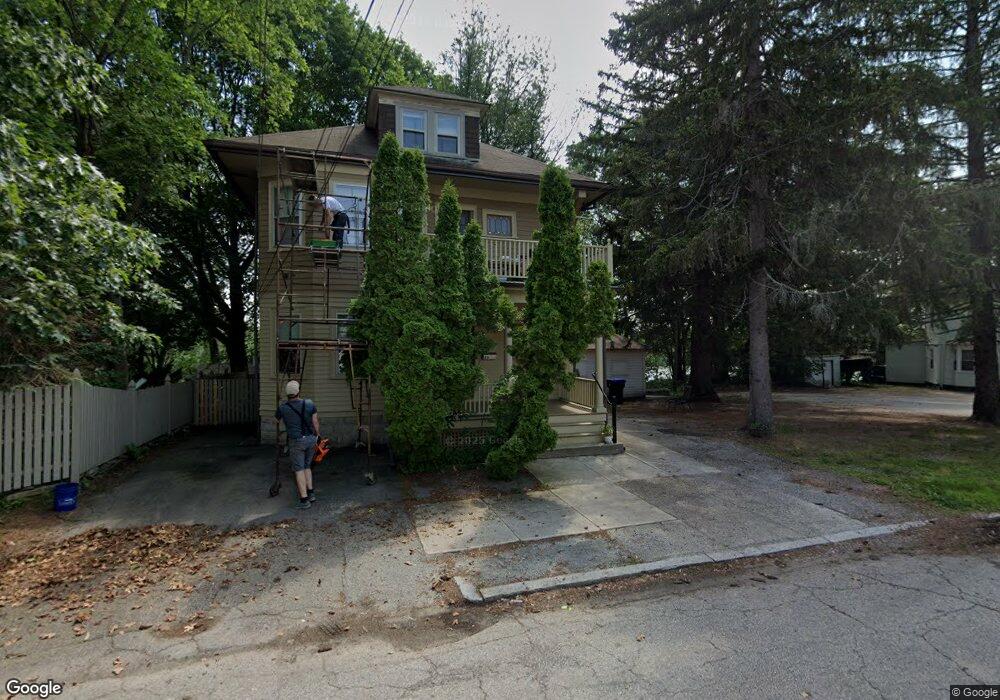
26 Crescent St Providence, RI 02907
Estimated Value: $393,509 - $622,000
4
Beds
2
Baths
2,170
Sq Ft
$233/Sq Ft
Est. Value
About This Home
This home is located at 26 Crescent St, Providence, RI 02907 and is currently estimated at $506,127, approximately $233 per square foot. 26 Crescent St is a home located in Providence County with nearby schools including Asa Messer Elementary School, Charles N. Fortes Elementary School, and Alfred Lima Sr. Elementary School.
Ownership History
Date
Name
Owned For
Owner Type
Purchase Details
Closed on
Jun 9, 2011
Sold by
Fonseca Mark and Clark Susan K
Bought by
2002 Assoc and Fonseca
Current Estimated Value
Home Financials for this Owner
Home Financials are based on the most recent Mortgage that was taken out on this home.
Original Mortgage
$100,000
Outstanding Balance
$69,271
Interest Rate
4.81%
Mortgage Type
Purchase Money Mortgage
Estimated Equity
$436,856
Purchase Details
Closed on
Jul 24, 1987
Bought by
Fonseca Mark
Create a Home Valuation Report for This Property
The Home Valuation Report is an in-depth analysis detailing your home's value as well as a comparison with similar homes in the area
Home Values in the Area
Average Home Value in this Area
Purchase History
| Date | Buyer | Sale Price | Title Company |
|---|---|---|---|
| 2002 Assoc | -- | -- | |
| Fonseca Mark | $80,000 | -- |
Source: Public Records
Mortgage History
| Date | Status | Borrower | Loan Amount |
|---|---|---|---|
| Open | Fonseca Mark | $100,000 | |
| Closed | Fonseca Mark | $100,000 |
Source: Public Records
Tax History Compared to Growth
Tax History
| Year | Tax Paid | Tax Assessment Tax Assessment Total Assessment is a certain percentage of the fair market value that is determined by local assessors to be the total taxable value of land and additions on the property. | Land | Improvement |
|---|---|---|---|---|
| 2025 | $5,992 | $428,000 | $126,700 | $301,300 |
| 2024 | $5,465 | $297,800 | $85,100 | $212,700 |
| 2023 | $5,465 | $297,800 | $85,100 | $212,700 |
| 2022 | $5,301 | $297,800 | $85,100 | $212,700 |
| 2021 | $4,524 | $184,200 | $54,300 | $129,900 |
| 2020 | $4,524 | $184,200 | $54,300 | $129,900 |
| 2019 | $4,524 | $184,200 | $54,300 | $129,900 |
| 2018 | $4,270 | $133,600 | $49,400 | $84,200 |
| 2017 | $4,270 | $133,600 | $49,400 | $84,200 |
| 2016 | $4,270 | $133,600 | $49,400 | $84,200 |
| 2015 | $3,757 | $113,500 | $38,400 | $75,100 |
| 2014 | $3,831 | $113,500 | $38,400 | $75,100 |
| 2013 | $3,831 | $113,500 | $38,400 | $75,100 |
Source: Public Records
Map
Nearby Homes
- 29 Crescent St
- 35 Humes St
- 354 Adelaide Ave
- 32 Stadden St
- 165 Rounds Ave
- 137 Rutherglen Ave
- 26 Westmore St
- 6 Tobyhanna St
- 11 Togansett Rd
- 444 Niantic Ave
- 246 Sackett St
- 31 Burrows St
- 41 Cottage St
- 182 Adelaide Ave Unit 3
- 187 Warrington St
- 31 Carter St Unit 33
- 154 Gallatin St Unit 156
- 132 Atlantic Ave
- 128 Elsie St
- 136 Frankfort St