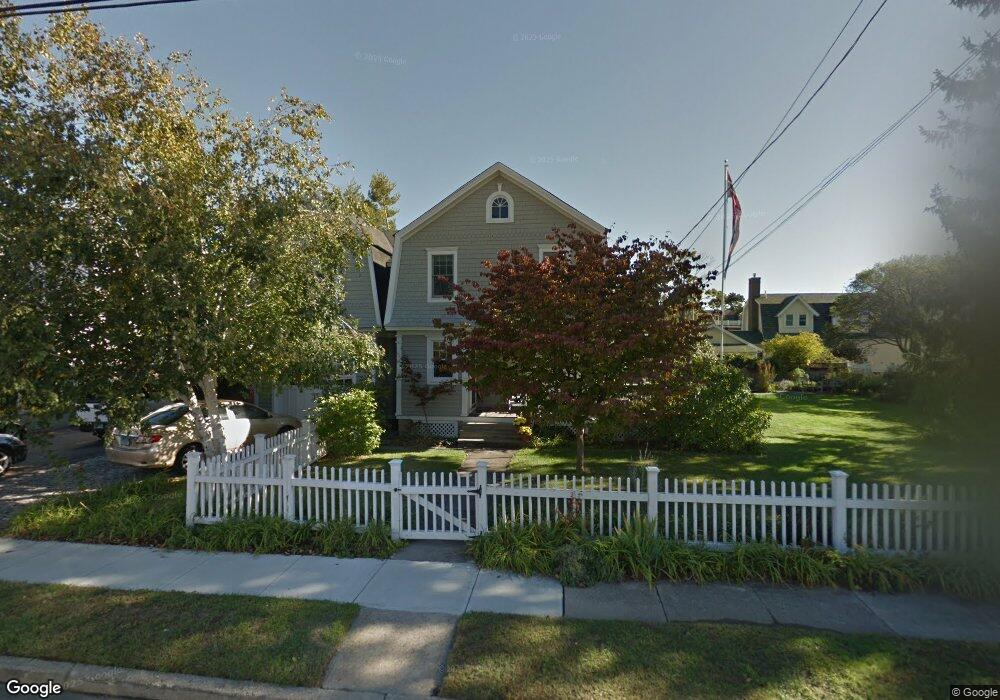
26 Crown St Milford, CT 06460
Downtown Milford NeighborhoodEstimated Value: $763,000 - $1,130,000
4
Beds
3
Baths
2,866
Sq Ft
$333/Sq Ft
Est. Value
About This Home
This home is located at 26 Crown St, Milford, CT 06460 and is currently estimated at $952,962, approximately $332 per square foot. 26 Crown St is a home located in New Haven County with nearby schools including Calf Pen Meadow Elementary School, Harborside Middle School, and Jonathan Law High School.
Ownership History
Date
Name
Owned For
Owner Type
Purchase Details
Closed on
Jan 29, 2025
Sold by
Wing Stephen S
Bought by
Stephen S Wing T S and Stephen Wing
Current Estimated Value
Purchase Details
Closed on
Jun 5, 1979
Bought by
Wing Stephen S and Wing Gunvor L
Create a Home Valuation Report for This Property
The Home Valuation Report is an in-depth analysis detailing your home's value as well as a comparison with similar homes in the area
Home Values in the Area
Average Home Value in this Area
Purchase History
| Date | Buyer | Sale Price | Title Company |
|---|---|---|---|
| Stephen S Wing T S | -- | None Available | |
| Stephen S Wing T S | -- | None Available | |
| Wing Stephen S | -- | -- |
Source: Public Records
Mortgage History
| Date | Status | Borrower | Loan Amount |
|---|---|---|---|
| Previous Owner | Wing Stephen S | $200,000 | |
| Previous Owner | Wing Stephen S | $100,000 |
Source: Public Records
Tax History Compared to Growth
Tax History
| Year | Tax Paid | Tax Assessment Tax Assessment Total Assessment is a certain percentage of the fair market value that is determined by local assessors to be the total taxable value of land and additions on the property. | Land | Improvement |
|---|---|---|---|---|
| 2025 | $13,974 | $472,900 | $192,960 | $279,940 |
| 2024 | $13,780 | $472,900 | $192,960 | $279,940 |
| 2023 | $12,849 | $472,900 | $192,960 | $279,940 |
| 2022 | $12,603 | $472,900 | $192,960 | $279,940 |
| 2021 | $11,880 | $429,650 | $168,840 | $260,810 |
| 2020 | $11,893 | $429,650 | $168,840 | $260,810 |
| 2019 | $11,906 | $429,650 | $168,840 | $260,810 |
| 2018 | $11,918 | $429,650 | $168,840 | $260,810 |
| 2017 | $11,940 | $429,650 | $168,840 | $260,810 |
| 2016 | $11,938 | $428,800 | $168,840 | $259,960 |
| 2015 | $11,955 | $428,800 | $168,840 | $259,960 |
| 2014 | $11,672 | $428,800 | $168,840 | $259,960 |
Source: Public Records
Map
Nearby Homes
- 145 Rogers Ave
- 139 Rogers Ave
- 87 Trumbull Ave Unit 5
- 129 Rogers Ave
- 236 Rogers Ave
- 39 Thompson St
- 30 Kinloch St
- 9 Willow St
- 21 Willow St
- 66 Shell Ave
- 945 E Broadway
- 8 Oyster Landing Rd
- 51 Underhill Rd
- 83 Underhill Rd
- 864 E Broadway
- 9 Mayflower Ct
- 110 Meadowside Rd
- 48 Alden Place
- 590 Gulf St
- 8 Captains Walk