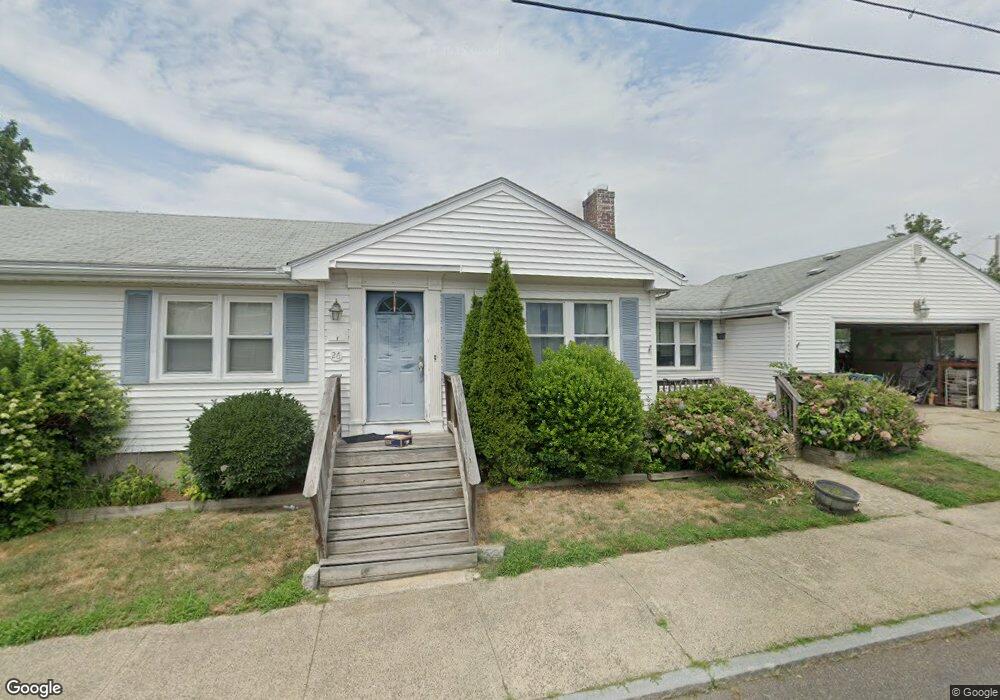
26 Cushing St Salem, MA 01970
North Salem NeighborhoodEstimated Value: $598,000 - $752,000
3
Beds
2
Baths
1,956
Sq Ft
$341/Sq Ft
Est. Value
About This Home
This home is located at 26 Cushing St, Salem, MA 01970 and is currently estimated at $667,228, approximately $341 per square foot. 26 Cushing St is a home located in Essex County with nearby schools including Bates Elementary School, Witchcraft Heights Elementary School, and Saltonstall School.
Ownership History
Date
Name
Owned For
Owner Type
Purchase Details
Closed on
Mar 25, 2011
Sold by
White Christine M and White Christopher T
Bought by
Murray Timothy and Murray Molly
Current Estimated Value
Home Financials for this Owner
Home Financials are based on the most recent Mortgage that was taken out on this home.
Original Mortgage
$243,662
Outstanding Balance
$167,104
Interest Rate
4.75%
Mortgage Type
FHA
Estimated Equity
$500,124
Purchase Details
Closed on
Oct 31, 2000
Sold by
Rogers Joan R
Bought by
White Christine M and White Christopher T
Create a Home Valuation Report for This Property
The Home Valuation Report is an in-depth analysis detailing your home's value as well as a comparison with similar homes in the area
Home Values in the Area
Average Home Value in this Area
Purchase History
| Date | Buyer | Sale Price | Title Company |
|---|---|---|---|
| Murray Timothy | $250,000 | -- | |
| White Christine M | $203,000 | -- |
Source: Public Records
Mortgage History
| Date | Status | Borrower | Loan Amount |
|---|---|---|---|
| Open | White Christine M | $243,662 | |
| Previous Owner | White Christine M | $380,000 |
Source: Public Records
Tax History Compared to Growth
Tax History
| Year | Tax Paid | Tax Assessment Tax Assessment Total Assessment is a certain percentage of the fair market value that is determined by local assessors to be the total taxable value of land and additions on the property. | Land | Improvement |
|---|---|---|---|---|
| 2025 | $6,069 | $535,200 | $210,700 | $324,500 |
| 2024 | $6,084 | $523,600 | $200,200 | $323,400 |
| 2023 | $5,820 | $465,200 | $184,800 | $280,400 |
| 2022 | $5,495 | $414,700 | $178,700 | $236,000 |
| 2021 | $5,320 | $385,500 | $166,300 | $219,200 |
| 2020 | $5,167 | $357,600 | $157,100 | $200,500 |
| 2019 | $5,068 | $335,600 | $149,100 | $186,500 |
| 2018 | $4,940 | $321,200 | $141,700 | $179,500 |
| 2017 | $4,676 | $294,800 | $119,500 | $175,300 |
| 2016 | $4,533 | $289,300 | $114,000 | $175,300 |
| 2015 | $4,309 | $262,600 | $104,700 | $157,900 |
Source: Public Records
Map
Nearby Homes
- 8 Cushing St Unit 2
- 5 Woodside St Unit 5-1
- 14 Margin St
- 78 Northend St
- 16 1/2 Symonds St
- 9 Shamrock St
- 43 Irving St
- 6 Englewood Rd
- 170 North St
- 52 Dunlap St
- 1 Dennis St
- 5 School St Unit 6
- 143 North St Unit 2
- 144 North St
- 4 Northend St
- 138 North St Unit B
- 75 Walnut St Unit 116
- 5 Tremont Place
- 62 Wallis St
- 46 Wallis St