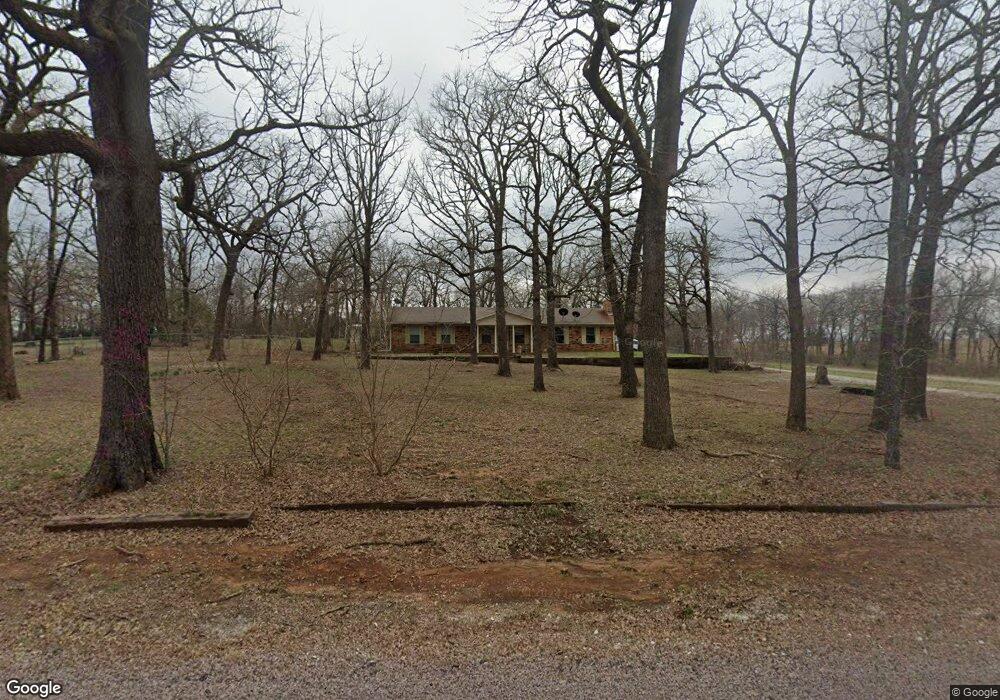
26 Darryl Dr Denison, TX 75021
Estimated Value: $345,435 - $543,000
3
Beds
2
Baths
1,942
Sq Ft
$219/Sq Ft
Est. Value
About This Home
This home is located at 26 Darryl Dr, Denison, TX 75021 and is currently estimated at $425,109, approximately $218 per square foot. 26 Darryl Dr is a home located in Grayson County with nearby schools including Bells Elementary School, Pritchard Junior High School, and Bells High School.
Ownership History
Date
Name
Owned For
Owner Type
Purchase Details
Closed on
Apr 27, 2016
Sold by
Gaskins Terry L and Gaskins Vickie D
Bought by
Alford Gary D and Alford Erin
Current Estimated Value
Home Financials for this Owner
Home Financials are based on the most recent Mortgage that was taken out on this home.
Original Mortgage
$160,200
Outstanding Balance
$67,205
Interest Rate
2.99%
Mortgage Type
New Conventional
Estimated Equity
$357,904
Purchase Details
Closed on
Jan 28, 2013
Sold by
Russell Billy J and Russell Jeannie D
Bought by
Gaskins Terry L and Gaskins Vickie D
Home Financials for this Owner
Home Financials are based on the most recent Mortgage that was taken out on this home.
Original Mortgage
$126,000
Interest Rate
3.42%
Mortgage Type
New Conventional
Create a Home Valuation Report for This Property
The Home Valuation Report is an in-depth analysis detailing your home's value as well as a comparison with similar homes in the area
Home Values in the Area
Average Home Value in this Area
Purchase History
| Date | Buyer | Sale Price | Title Company |
|---|---|---|---|
| Alford Gary D | -- | None Available | |
| Gaskins Terry L | -- | Chapin Title Co Inc |
Source: Public Records
Mortgage History
| Date | Status | Borrower | Loan Amount |
|---|---|---|---|
| Open | Alford Gary D | $160,200 | |
| Previous Owner | Gaskins Terry L | $126,000 |
Source: Public Records
Tax History
| Year | Tax Paid | Tax Assessment Tax Assessment Total Assessment is a certain percentage of the fair market value that is determined by local assessors to be the total taxable value of land and additions on the property. | Land | Improvement |
|---|---|---|---|---|
| 2025 | $5,993 | $361,666 | $124,013 | $237,653 |
| 2024 | $5,993 | $376,647 | $127,489 | $249,158 |
| 2023 | $6,425 | $403,238 | $120,992 | $282,246 |
| 2022 | $6,243 | $364,160 | $76,826 | $287,334 |
| 2021 | $5,255 | $277,679 | $52,767 | $224,912 |
| 2020 | $4,477 | $226,442 | $41,789 | $184,653 |
| 2019 | $4,381 | $205,739 | $41,789 | $163,950 |
| 2018 | $4,136 | $194,415 | $36,256 | $158,159 |
| 2017 | $4,003 | $186,949 | $36,256 | $150,693 |
| 2016 | $2,769 | $131,389 | $36,256 | $95,133 |
Source: Public Records
Map
Nearby Homes
- 263 Esquire Dr
- 10 Ac Fm 1753 Hwy
- TBDT Dugan Chapel Rd
- 131 Dugan Chapel Rd
- TBD Dugan Chapel Rd
- 5994 Fm 1753
- 0 Tbd2 Fleming Rd
- 0 Fleming Rd
- TBD Lil Arkansas Rd
- 469 Dugan Chapel Rd
- 598 Stagecoach Trail
- 40 acres Neq of Hwy 69 and Hwy 82 Hwy
- 248 Shaffer Rd
- 6294 Dugan Chapel Rd
- 2760 Fm 1897
- 4822 Fm 1753
- 4942 Us Highway 69
- TBD Neq of Hwy 69 and Hwy 82 H Hwy Unit Lot 9
- TBD Neq of Hwy 69 and Hwy 82 Hwy Unit Lot 13
- TBD Neq of Hwy 69 and Hwy 82 Hwy Unit Lot 7
Your Personal Tour Guide
Ask me questions while you tour the home.